In 2012 the Irish government received �4.2bn
in corporation tax and �15.18bn in income tax.
Advanced Tax Agreements (ATAs)
Glanbia�s �1bn Luxembourg move
to cut its Irish tax bill
(The Irish Times)
More than 340 firms got tax
deals from Luxembourg, leaked documents show
Irish food multinational Glanbia has put more than �1
billion into companies in Luxembourg that have no employees
but serve to reduce its tax bill here.
The companies are the subject of advanced tax agreements (ATAs)
negotiated with the tax authorities in Luxembourg and
feature in 28,000 pages of leaked documentation from
PricewaterhouseCoopers (PwC) in Luxembourg detailing ATAs
with multinational companies around the globe.
The leaked documents have been shared by the Washington
DC-based International Consortium of Investigative
Journalists (ICIJ) with more than 40 media groups around the
world, including The Irish Times.
The leaked documents show how Pepsi, Ikea, FedEx and 340
other companies secured tax deals from Luxembourg, allowing
many of them to slash their tax bills while maintaining
little presence in the tiny European Union member state.
The material also shows how foreign multinationals use
Ireland as part of Luxembourg- based structures that reduce
their corporation tax bills in the Republic and elsewhere.
Transactions covered by the ATAs include cross-border loans
that create interest costs that can be charged against tax
outside Luxembourg but which create relatively tiny tax
charges in Luxembourg.
The Organisation for Economic Co-operation and Development
has noted in a recent report on global tax change that
$1,987 billion went into Luxembourg special-purpose entities
� companies that often have few if any employees � as part
of global financing and tax planning structures. Most of the
money came straight back out again.
"Effective corporate tax, like effective
income tax, is the rate which is paid once reliefs, allowances,
exemptions and depreciation is taken into account.
The average corporate tax rates � over 30 percent statutory � falls to
18 percent effective.
For example, France falls from over 35 statutory
percent to 14 percent effective � nearly a 50 percent fall. France is
below the Eurozone average."
"Leading US senators push Irish
government to fully tax Apple, Google etc.
Ireland's days as a tax haven for American tax companies, such as
Apple, Google and Facebook, may soon end if US senators get their way.
The chairman of the Senate Permanent Subcommittee on Investigations,
Carl Levin (D-Mich.), and Sen. John McCain (R-Ariz.) are again
attempting to curtail the �Double Irish and Dutch Sandwich�
tax-avoidance scheme (in which American-owned companies use Irish and
Dutch subsidiaries to funnel profits into low- or no-tax jurisdictions)
The proposed policy change would move Ireland a step closer to fully
charging companies its official 12.5 percent corporate tax rate.
Loopholes frequently lower the tax rate to around 3 percent.
�The US government is losing tens of billions of dollars at a time when
we are revenue-constrained, worrying about the deficit, cutting spending
� you know, we need all the money we can get,� said economist Bruce
Bartlett, a former domestic policy adviser to Ronald Reagan.
The Double Irish utilizes loopholes in US and Irish tax laws to move
profits of US multinationals from Ireland to jurisdictions with zero
corporate-tax rates, such as Bermuda.
The so called Dutch sandwich shifts profits in Ireland through the
Netherlands en route to Bermuda.
The Post reports that Audit Analytics notes that major US companies
pumped up their offshore earnings by 15 percent last year to a record
$1.9 trillion by posting profits outside the US and avoiding a huge tax
bill."
Ireland is world's fourth most expensive
for petrol
[A] report, by Louth accountants, UHY
Farrelly Dawe White, also found that Irish diesel prices are the fifth
highest in the world.
It costs about �139 to fill the tank of a Ford Transit with petrol in
Denmark; in Ireland, it costs about �128. The cheapest place to buy
petrol is the United Arab Emirates (UAE) followed by Malaysia, Mexico
and the US. It costs �27 to fill up a tank with petrol in the UAE, �37
in Malaysia, �52 in Mexico and �55 in the US.
Taxes account for almost 60 per cent of the cost of filling up the tank
of a Ford Transit with petrol in Ireland, compared to about 13 per cent
in the US. There are no fuel taxes in China or Malaysia.
A typical Irish driver pays about �2,754 a year in fuel and �1,652 of
this is tax.
A spokeswoman for the Department of Finance said fuel prices are driven
by several factors "including the price of oil on international markets,
exchange rates, production costs and refining costs".
Tax hikes drive price of petrol and
diesel up European league table
A survey of 27 countries carried out this
month by the Automobile Association (AA ) found that drivers in Norway
pay the most for a litre of petrol � �1.92 � despite owning all the
North Sea oil off their shores.
They are followed by the Netherlands (�1.86), Italy (�1.81), Sweden
(�1.77) and Greece (�1.72). Poland had the cheapest fuel at the
forecourt, charging its drivers just �1.32 a litre, closely followed by
Latvia (�1.34), Estonia (�1.36) and Luxembourg (�1.37).
Our nearest neighbours in the UK pay slightly more, forking out �1.61
for every litre they buy. Ireland is in 12th place. The price of petrol
and diesel crept upwards at the pumps this month for the first time
since last September.
AA corporate affairs spokesman Conor Faughnan said: "We used to have the
cheapest petrol in Europe in 2008. But since October that year, the
various government taxes have added 23c onto a litre of petrol."
"In countries like Norway they have higher fuel taxes, but they don't
have the full range of motor taxes we have, such as VAT, insurance levy,
Vehicle Registration Tax, tolls, motor tax. We have them all."
The Government Should now Come Clean on
Water Charges
November 05, 2014
Michael Taft, Research Officer, UNITE the Union
I admit I can�t let this issue go but such is the misrepresentation,
partial information and deliberate obfuscation being put out in the
debate that it goes beyond a narrow calculation. It actually reveals a
Government determined to hide the facts in pursuit of a policy which
caused over 150,000 to demonstrate last weekend.
Yes, I�m talking about water charges � but specifically about the
estimated impact on the deficit if water charges were removed. And now
Dr. Tom McDonnell over at the Nevin Economic Research Institute has done
his own sums � and they mirror what I had previously calculated here.
The Government is claiming that removing the water charges would �cost�
�800 million (this was run out again on Morning Ireland today). Is this
correct? No. Let�s look at how the Government is obscuring the real
numbers and see if we can find the right ones. If this gets a little
�number-dense� please stay with it for it is about more than just
abstract calculations; it is about how the Government is treating this
issue and the public at large. All numbers are approximate and rounded.
I have produced a summary table below.
First, the total cost of water service provision is �1.3 billion (�700
million in current spending and �600 million in investment).
Second, the Government is committing �500 million from the Local
Government Fund to Irish Water. This is �on the books�; that is, this is
counted as government expenditure.
Third, this leaves a saving to the Government of �800 million.
So far, pretty clear. The Gvvernment's argument seems to stack up. But,
no, this is not the case. Because the Government is losing �250 million
in revenue. This is the amount collected through commercial water
charges on businesses This used to Government coffers. Now it belongs to
Irish Water.
So the Government gains �800 million savings on the expenditure side but
loses �250 million on the revenue side. This leaves a saving of
approximately �550 million. This is pretty much the same number that Dr.
McDonnell arrives at: �527 million.
Ok, so we have sorted that out. The actual cost of removing water
charges would be �550 million � yes? No, that's not it either. Because
the Government is spending money as part of the move to water charging �
spending that wouldn�t exist if there weren�t the charges. Dr. McDonnell
states that he doesn�t factor these in. So let�s do that. There are
three expenditures:
First, Social Protection is increasing subsidies to the Household
Benefit Package and recipients of the National Fuel Allowance scheme �to
offset the cost of their water bills�. This will cost �66 million.
Second, a water tax credit scheme is being introduced. This will cost
�40 million.
Finally, the cost of providing free water allowanced for children is �on
the books�; that is, it is counted as government expenditure.
�Social transfers in kind include such items as free travel on public
transport, fuel allowances and the child-based free allowance related to
water charges.�
�How much does this cost? The Government doesn�t say. But we can
estimate. There were approximately 1,170,000 recipients of Child
Benefit. Each one of these children should be receiving a free water
allowance of 21,000 litres per year. On the basis that this will cost
�102 per child, this brings the total cost to �119 million. But this is
just an estimate so let�s be conservative and round it down to �100
million.
When we add up these costs � Social Protection subsidies, tax relief and
free water allowances for children � it comes to �200 million. This will
�cost� the Government.
When we subtract these expenditures from the �550 million net savings to
the Government from moving Irish Water off the books, the bottom-line
savings is between �300 and �350 million. Here�s the summary table.
Water Deficit
So the Government claims removing water charges will cost �800 million.
But when we factor in the lost revenue (commercial water charges) and
additional expenditure (Social Protection subsidies and tax cuts), the
net cost will less than half that: between �300 and �350 million.
Why is this so important? Because it shows that if water charges were
removed, the impact to the deficit would be miniscule (0.16 percent of
GDP). This would still leave the Government well below the deficit
target. The Government is refusing to listen to people not because it
would undermine their deficit target but because . . . well, you supply
the answer.
The Government can claim its numbers are right � but only if they ignore
the losses and additional expenditure. This is highly misleading. They
do not refer to net costs; they do not refer to the net impact on the
deficit. This is no way to debate public finances.
Why �gross� income inequality matters
Cormac Staunton
Gross income inequality is the
inequality of incomes from the market - including wages, self-employed
incomes and investments. When we look these incomes in Ireland over a
period of time we see a growing concentration of income in the Top 10%,
and in particular the Top 1%.
During the period of economic growth from
the early 1990s, the share of income earned by the Top 10% in Ireland
rose, meaning that the vast majority of people, the �Bottom 90%� of the
population, lost a proportional share of the national income. The Bottom
90% share of national income fell from 71.4% in 1975 to 63.9% in 2009.
'wealth being defined as current value of all assets'
*********
Irish Statute Book
Wealth Tax Act, 1975 '�private non-trading company� means a company whose income in the
twelve months preceding the valuation date consisted wholly or mainly of
investment income'
A NEW LEVY on the wealthy
and minimum taxes for high earners are among the
measures called for in a pre-Budget submission from the
Irish Congress of Trade Unions.
An annual one per cent tax
on all wealth above �2million � including the value of
houses above �1million � could take in around
�500million a year for the State, according to the
document.
Claiming Our Future has
outlined a menu of proposals to generate badly needed
revenue to protect mid to low incomes, minimise cuts to
public services and create jobs.
These include:
a) a levy on assets and property worth over �1 million
b) high net worth Irish citizens paying their dues here
so that the number of tax exiles decreases
c) eliminating tax breaks for those with high incomes so
that they pay their fair share
d) a levy on financial transactions over significant
amounts (known as a Tobin tax) and
e) a higher tax rate on incomes over �100,000.
The revenue to be generated
from a wealth tax on assets worth over �1 million could
generate between �500 and �600 million alone per annum.
Tax expenditures in the main benefit the highest paid.
80 per cent of pension reliefs go to the top 20 per
cent of earners.
Property-related tax expenditures also disproportionably
benefit the most well off.
Tax expenditures like these effectively mean average and
low earners subsidise high earners. Changes in tax
expenditures in the area of pensions and property
related reliefs could save the exchequer in the region
of �1billion.
Minister Noonan said that between �52 million and �312
million a year could be brought in each year with a higher income tax
rate of between 42 per cent and 47 per cent for people earning over
�100,000.
Local Property Tax brought in �318 million
in 2013.
**********
Corporation Tax
Corporation Tax for
Accounting Period 2008 in �million:
The Revenue is notified of
trading profits of �65 billion. Yet it only receives a
mere �3.9 billion in tax. This represents an effective
tax rate of six percent. In other words, companies pay
less than half the official tax rate.
Poorest 10% of households
pay higher proportion of income in tax than richest 10%
New research on the total
amount of tax Irish people pay finds that the poorest
10% of households pay a larger share of their income in
tax than the richest 10%.
When income tax and indirect taxes such as VAT are
included in the calculations the study conducted by the
Nevin Economic Research Institute finds that:
The poorest 10% of
households pay just over 30% of their income in taxes -
mostly in the form of indirect taxes levied on the
things they spend money on.
The richest 10% spend 29.5%
of their income on tax - mostly in the form of direct
income tax.
The combined tax burden
produces a u-shaped graph, with the bottom and top of
the income distribution paying most, and those on lower
middle incomes paying least.
The research was conducted
by Dr Miche�l Collins, a former member of the Commission
on Taxation. It highlights the importance of Government
thinking more broadly when considering changes to
taxation. The whole system needs to be addressed when
changes are being made, not just the income tax system.
So what about our own home-grown 1 percent?
How much wealth do they own � wealth that translates
into economic and political power? The Credit Suisse�s
Global Wealth Data Handbook 2011
(not yet available
free on-line) can give us an insight � as they estimate
the concentration of wealth holdings in the top percent
deciles.
Irish concentration of
wealth is one of the highest in the EU-15. 28 percent
of all wealth � housing and financial wealth � is owned
by the top 1 percent of adults. That�s a lot wealth for
a handful of people.
While Credit Suisse uses US
$ in their tables, we can take their proportions to
estimate how much this means in Euros and cents. They
estimate that financial wealth makes up 47 percent of
all wealth.
Using CSO data, we therefore find the following:
The Top 1 percent is made up
of approximately 36,000 adults.
This group owns
approximately �130.2 billion.
�130.2 billion. Just take a
moment to reflect on that.
[Pause for quiet
reflection on the amount of wealth owned by 36,000
adults in Ireland]
On average, this means
that every adult in the top 1 percent owns �3.8 million.
The state operated a wealth tax from 1975.
However while the initial legislation was quite strong, the Fine Gael Labour government of the day bowed to pressure and included a large
number of exemptions in the final act.
As a result the yield was low. The legislation was repealed in 1978.
The ESRI study produced a detailed research paper into the design and
operation of the wealth tax in 1985. The
report said that, �Opponents of the Wealth Tax argued that it had
detrimental effects especially on investment,
but there is no convincing evidence to support this contention.�
However the study also concluded that the cost of administering the tax
was �exceptionally high�. The most
effective way to avoid this key concern of the ESRI report is to make
any wealth tax self-assessed.
What Assets Are Included? � All income and savings � Stocks and shares and all other financial products in public companies � Shares in private non-trading companies � Land � Buildings � Second and subsequent homes including holiday homes � Personal possessions including art, cars, boats, planes, jewellery,
gold
How much would Sinn F�in�s wealth tax
raise?
In a D�il debate in 2011, Minister for Finance Michael Noonan estimated
that a French-type wealth
tax implemented here would raise between �400million and �500million in
a full tax year. Since then
the French government has strengthened the legislation underpinning
their wealth tax and expect
the annual yield to double. Based on data from the Central Bank, the CSO and Capgemini World Wealth
Report, Sinn F�in has
estimated that a wealth tax could bring in up to 0.5% of GDP or
�800 million in a full tax year.
Moving the Faberge egg
abroad is why wealth tax won't work
A levy on the super rich
often only scares away the people who create jobs and
wealth
Here in Ireland, Sinn
Fein has often called for a tax on the super rich and
Francois Hollande has introduced one in France creating
tax exiles out of well-known French citizens such as
Gerard Depardieu, members of the Peugeot family or
Chanel's owners.
Earlier this year, the Bundesbank and the International
Monetary Fund joined the fray when they both called for
some sort of one-off wealth tax in countries, like
Ireland, which effectively went bust. Indeed, in the
Cyprus bailout there really was a one-off tax on anybody
with substantial bank savings; a precedent likely to be
repeated in future bailouts.
Capital in the Twenty-First Century, the unexpected US
bestseller by Thomas Piketty is only the latest in a
long line of economic tracts to offer some sort of
intellectual argument underpinning wealth tax.
In the last century, wealth taxes were also popular with
economists as varied as Joseph Schumpeter and John
Maynard Keynes although the latter changed his mind in
later life.
Ireland's top tax rate just 'nonsense',
says Piketty Nobel-tipped economist argues for redrawing tax based on 'real' wealth
His solution is steeply rising taxes on wealth and high
incomes. The top rate on earnings above �2m a year could reach 80 per
cent, with different high rates at �500,000 and �1m a year.
He blames low tax rates � he includes the 52 per cent rate in Ireland �
for the explosion in top salaries for bankers and senior executives.
"If you're paying 50 per cent, it is well worth getting a �1m pay rise.
If 80 per cent is going to go on tax, it changes the whole situation. "That was the ratio in Britain when it had taxes of this level in the
Sixties. The USA also did it in the Thirties, although continental
European countries never went that high. "The extraordinary thing from my data is that the share of wealth
belonging to the top 10 per cent in France is the same as it was before
the Revolution. It is as if the ancien regime had never come to an end."
But he is shocked that the Irish top rate kicks in at below-average
earnings. "That is nonsense. You have to be very careful about the marginal rate
that you apply to particular incomes," he said.
"Deposit interest retention tax
(DIRT) is a form of tax on interest earned on bank accounts in Republic
of Ireland that was first introduced in the 1980s. In Ireland, income
from any source is reckonable for taxation purposes.
The Revenue Commissioners believed that the
large majority of interest earners were declining to report it and that
the most efficient method to collect at least the basic rate tax would
be to deduct it at source. After PAYE, it was Ireland's second
experience of a withholding tax.
DIRT is deducted at source by financial institutions. The rate of
DIRT (since Jan. 2013) is 33% up until the 2014 budget which it now
stands at 41%, except where interest cannot be calculated at least
annually and cannot be determined until it is paid, in which case it is
36%."
"Deposit Interest Retention Tax (D.I.R.T.), at the rate of 33% (from the
1st January 2013) is deducted at source by deposit takers (e.g. banks,
building societies, Credit Unions, Post Office Savings Bank, etc.) from
interest paid or credited on deposits of Irish residents.
The above D.I.R.T. rate was:
30% for the period 1st January 2012
to the 31st December 2012
27% for the period 1st January 2011 to the 31st December 2011
25% for the period 8th April 2009 to the 31st December 2010
23% for the period 1st January 2009 to the 7th April 2009 and
20% for the period 1st Janury 2002 to the 31st December 2008"
�DIRT� tax on savings interest to rise to 41 per cent
Oct 15 2013
"The measure means those saving money will have to hand �41 back to the
state for every �100 in interest they accrue.
FINANCE MINISTER MICHAEL Noonan has confirmed an increase in the rate of
annual DIRT tax applied to savings interest, from 33 per cent to 41 per
cent.
It means those saving money will have to hand �41 back to the state for
every �100 in interest they accrue.
Aimed at convincing people to spend money rather than sit on large sums,
the move has been criticised by accountants Grant Thornton � which says
is may encourage people to try and evade the payment:
�The DIRT tax on savings has now gone from 20 per cent to 41 per cent in
a short period of time,� partner with the firm Peter Vale said.
�Whilst the move may encourage people to stop hoarding cash and invest
in more productive assets, it also increases the likelihood of greater
non compliance in terms of returning details of interest income to
Revenue.�"
"Preliminary data from the US Bureau of
Economic Analysis (BEA) on majority-owned foreign affiliates of US firms
show that in 2010 (latest available), Irish-based firms reported net
income of $95.6bn and a payroll count of 98,500, which gives profits per
employee of $970,000.
In one recent year, the profits per
employee at US-owned companies in Ireland were at $970,000 while the
corporate tax paid in Ireland was about $25,000 (�19,000)."
"Ireland is not just a league-leader, it
is off the chart.
MNCs here make more than four times the
profit per employee than the average of the other EU-15 countries
reporting (no data for Belgium or Greece).
No wonder more and more multi-nationals
are making Ireland their home.
It should be noted that this Eurostat
data does not include the financial sector, so the massive profits being
made in the IFSC are not included. Nor does the above include taxation."
"In each of these sectors � particularly
retail and transport � MNC profits in Ireland significantly exceed the
average of other countries.
Only in two sectors � the Professional & Scientific and Accommodation �
is MNC profit in Ireland lower than the average of other EU countries.
These two sectors, however, are relatively small, making up less than
two per cent of the turnover of all MNCs in Ireland."
'Forbes names Ireland as �best country for
business�'
Colin Gleeson Thu, Dec 5, 2013,
"Article in influential US magazine says economic downturn has made
Ireland more attractive.
Ireland has for the first time been named as the �best country for
business� in rankings carried out by renowned US financial magazine
Forbes.
Ireland has moved up from sixth position in the influential rankings
last year. The rankings are determined by grading 145 nations on 11
different factors: property rights, innovation, taxes, technology,
corruption, freedom (personal, trade and monetary), red tape, investor
protection and stock market performance.
Each category is equally weighted and the data comes from published
reports from the following organisations: Freedom House, Heritage
Foundation, Property Rights Alliance, Transparency International, World
Bank and World Economic Forum.
In an article announcing the results of the rankings, Forbes describe
Ireland as having been �devastated� by the recession and in receipt of
an �85 billion bailout to prop up the banking system.
�Despite these economic troubles, Ireland still maintains an extremely
pro-business environment that has attracted investments by some of the
world�s biggest companies over the past decade,� says the magazine.
�Ireland scored well across the board when measuring its business
friendliness. It is the only nation that ranks among the top 15 per cent
of countries in every one of the 11 metrics we examined to gauge the
best countries,� says the article.
Ireland ranked �near the very top� for low tax burden, investor
protection and personal freedom.
The article quotes Moody�s Analytics� economist Melanie Bowler who
specialises on Ireland. She says Ireland has continued to attract direct
foreign investment �despite its problems�.
She highlights the �educated workforce� and 12.5 per cent corporate tax
rate as �big draws� for companies, as well as the language factor. �You
want to have a common language if you are setting up operations in
Europe,� she says.
�Dublin has already established itself as a location for multinationals,
so it has the necessary infrastructure for other companies to easily
move into the country and set up shop.�
The article in Forbes also says the State�s recent troubles have made it
�more attractive� for companies moving in.
�Nominal wages fell 17 per cent between 2008 and 2011, which helped keep
labour costs in check. Unemployment remains stubbornly high � a recent
12.8 per cent � providing companies a large labour pool to pick from.
�There are now more than 1,000 overseas companies with a presence in
Ireland and they employ 150,000 of the nation�s 1.9 million workers.�
New Zealand placed second in the rankings � down from first place last
year � while Hong Kong completed the top three.
Minister for Jobs, Enterprise and Innovation Richard Bruton said the
finding by Forbes was a testament to the hard work and innovation of
Irish businesses and workers.
Speaking from Indonesia where he is attending the World Trade
Organisation ministerial conference, he said: �It is the latest in a
range of indicators which shows that the environment for business here
is steadily improving, and shows that the hard work and sacrifices of so
many people are yielding tangible results in terms of international
competitiveness and the jobs we so badly need.�"
Current
expenditure is recurring spending or, in other words, spending on items
that are consumed and only last a limited period of time.
They are
items that are used up in the process of providing a good or service.
In the
case of the government, current expenditure would include wages and
salaries and expenditure on consumables - stationery, drugs for health
service, bandages and so on.
What is Capital Expenditure?
Capital
expenditure is spending on assets.
It is the
purchase of items that will last and will be used time and time again in
the provision of a good or service.
In the
case of the government, examples would be the building of a new
hospital, the purchase of new computer equipment or networks, building
new roads and so on.
What is Gross domestic product (GDP) ?
Gross
domestic product (GDP) is the market value of all officially recognized
final goods and services produced within a country in a given period of
time.
GDP per capita is often considered an indicator of a country's
standard of living.
"Table 1.6 shows annual
capital expenditure by the state from 1997 to 2012.
The peak
in capital expenditure was in 2008 when �9bn was spent and
has fallen to under �4bn in 2012 representing a fall in
capital expenditure of 56%.
Capital expenditure was reduced
by a further �0.55bn in Budget 2013 and an additional �0.1bn
in savings via capital expenditure is planned for Budget
2014."
Major income and expenditure items,
2005-2015 (scenario), �bn
DSFA = spending by the Dept of Social &
Family Affairs
�GVC� refers to �Gross Voted Current� expenditure
�GVCap� refers to �Gross Voted Capital� expenditure
(All spending by the Government is either gross or net, voted or
non-voted and current or capital.)
Voted expenditure is
essentially the money allocated to government departments and offices.
Non-voted expenditure is money that is spent under specific legislation
and does not require a separate �vote�.
What will Ireland�s government
finances be like in 2015? A five-year view on the Budget
22 Dec 2009 [Ronan Lyons]
"What will Ireland�s government
finances look like in 2015, though? Will we be back in
Maastricht territory, with a Budget deficit of less than 3%?
What about our national debt? And how tough will the next
five Budgets be? To understand that, it�s necessary to go
right back to basics with Ireland�s finances.
For example, we all know that the Government will take in
just �34bn this year while spending over �60bn, right?
Wrong! Those figures are net figures, it turns out. To go
back to basics, we need to look at the gross figures, i.e.
count receipts such as PRSI and health levies as part of
income, as opposed to netting them off against government
expenditure. Doing that, total receipts for 2009 come to
just over �50bn, while total expenditure will top �76bn.
By coincidence, total receipts for 2005 were also just over
�50bn, giving us an appropriate year to compare ourselves
to. The distinction between gross and net turns out to be an
important one, because it reveals how the Government�s
funding sources have changed.
Whereas PRSI, other levies (such as the health levy) and
what is classed as �non-tax revenue� brought in about �10bn
in 2005, Budget 2010 estimates that these sources will bring
in over �17bn � a staggering 70% increase. (The
government�s income going up? Now, there�s a headline you
won�t read in the papers!)
Meanwhile, indirect, direct and other taxes (�other�
includes stamp duties and capital taxes) have fallen during
the same period from just under �40bn in 2005 (they actually
peaked in 2007 at �47bn) to about �32bn in 2009 and 2010.
It is in expenditure, however, where the real changes have
occurred. In 2005, instead of �69bn, total expenditure by
the Government was �51bn. To repeat, whereas the
Government�s total income next year will be the same as in
2005, expenditure will be more than one third higher.
Of the �18bn increase in spending, half has come from gross
spending on social welfare. Most of the remaning increase (a
further �7bn) has come from other current expenditure areas,
most notably health and education.
It�s worth pointing out that all the money spent on social
welfare and the vast majority of the money spent on health
and education goes in the form of someone else�s income."
"Gross
voted public expenditure for the period 1997 to 2013 is
summarised in the table above. The figures represent all
current and capital spending by Government Departments and
some of their agencies, including spending from the Social
Insurance Fund, but does not include non-voted spending
directly from the Central Fund such as debt-servicing costs.
All figures are actual outturn figures, apart from the
figures for 2013 which are in line with the Revised
Estimates published in April 2013, and the 2012 figures
which are the provisional outturn figures as also published
in the Revised Estimates in April 2013. The year-on-year
percentage variations are also shown."
http://per.gov.ie/expenditure-trends/
Gross Public Expenditure peaked
in 2009 but has been in decline since due to cutbacks.
"Both the
Fianna F�il and Fine Gael-Labour governments have set out to
severely curb the spending of the public sector. A glance at
any of the leading newspapers or other media demonstrates
that there is an overwhelming consensus that public spending
must be cut. Implicitly, and often explicitly, an
unsustainable level of public spending is held to be the
cause of the current crisis.
That this nonsense has such traction in the public debate
tells us more about the society in which that debate is
being conducted than about the economy itself. Prior to the
crisis, the level of public spending was 36.7 per cent of
GDP in 2007, nearly 10 percentage points lower than the euro
area average of 46 per cent."
http://www.theirelandinstitute.com/citizen/c04-burke-print.html
"Since 2008, the public finances have come
under increased strain due to a collapse of tax revenues and an increase
in expenditure on social transfers and debt servicing costs.
Table 1.7
depicts the deterioration of the underlying General Government Balance
(i.e. excluding once-off bank recapitalisation costs) from a small
surplus in 2007 to a large deficit of -11.5% in 2009."
http://www.publicpolicy.ie/irelands-current-fiscal-profile/
'Irish Budget 2014: Half of Ireland's
population on welfare'
By Michael Hennigan
Sep 2, 2013
"Half of Ireland's population is on welfare and when recipients of child
benefit, farmers dependent on public subsidies which are effectively
welfare, accounting for 81% of average farm income in 2012; legal
services costing the state about a half billion euros annually; public
payments to doctors; a raft of corporate welfare schemes and the public
service itself, [...] in Ireland there is a shining example of the
halfway house known as [...] dependency on the State.
This year, the Department of Social Protection will spend over �20.24bn
on its entire range of schemes, services, and administration. At the end
of May, there were 1.476m people receiving a weekly payment in respect
of 2.283m beneficiaries. In addition, some 614,000 families were in
receipt of the monthly child benefit payment.
The CSO estimated that the total population was at 4.593m in April
2013."
Gross fixed capital formation
(formerly gross domestic fixed investment) includes land improvements
(fences, ditches, drains, and so on); plant, machinery, and equipment
purchases; and the construction of roads, railways, and the like,
including schools, offices, hospitals, private residential dwellings,
and commercial and industrial buildings.
"Ireland�s budget deficit for 2012 has been revised upwards from �12.5bn
to just over �13.5bn making it the third largest in the EU.
The new figure means that the deficit represented 8.2% of GDP rather
than the 7.6% estimated back in April. According to the CSO, the
revision arose mainly from Government revenue from mobile phone licence
sales being initially recorded for 2012, rather than for 2013.
While the 8.2% figure is higher than first anticipated, it is still a
vast improvement on the 2011 deficit of �21.36bn; which amounted to
13.1% of GDP. Furthermore, it was still better than the 8.6% of GDP
target set by the troika for 2012.
Final annual data, published yesterday by Eurostat, the EU�s statistical
agency, showed only Spain and Greece as having a higher budget deficit
than Ireland last year. While Spain�s jumped from 9.6% of GDP to 10.6%;
Greece�s actually lowered from 9.5% in 2011 to 9% for last year.
While 15 member states saw their deficits improve last year, one
remained stable and 12 saw a worsening. Sweden, Estonia, Luxembourg and
Bulgaria had the lowest deficits � ranging from 0.2% of GDP to 0.8%.
Britain recorded a deficit of 6.1% of GDP; down from 7.7% in 2011.
Germany, meanwhile, was the only EU nation to deliver a government
surplus. Seventeen member states had deficits higher than 3% of GDP.
Eurostat also noted that as of the end of 2012, the lowest ratios of
government debt to GDP were recorded in Estonia, Bulgaria, Luxembourg
and Romania; with the highest observed in Greece, Italy, Portugal and
Ireland (117.4%, up from 104.1% in 2011). The eurozone�s deficit stood
at 3.7% of GDP, with the EU, as a whole, 3.9%.
The Government�s official deficit target, for 2013, has been set at 7.4%
of GDP, with some commentators suggesting it should marginally beat
that.
�Ireland�s strategy in the past couple of years has been to
under-promise and over-deliver on its budgetary targets, a trend that we
believe is likely to be maintained in 2013. Despite the fact that the
risks to the Government�s economic growth projections are clearly to the
downside at this juncture, we still think that come end-December the
budget deficit out-turn as a percentage of GDP will once more be lower
than the 7.4% figure officially targeted, as the Department of Finance
has allowed itself plenty of leeway. Our forecast is for a marginally
lower figure of 7.3%,� said Alan McQuaid of Merrion Stockbrokers."
"The Dept [of Finance] is forecasting
a general government budget deficit of �12.65 billion in 2013, or 7.5%
of GDP, below the expected budget deficit of �13.3 billion or 8.2% of
GDP for 2012. The decline in the budget deficit would be more pronounced
in 2013 but for the fact that sizeable interest payments totalling
almost �2 billion begin to fall due on the Promissory Note Programme.
This will boost the budget deficit by 1.1% in 2013.
In its Medium Term Fiscal Statement published last month, the government
projected that over �5 billion of further fiscal consolidation measures
will be required in 2014 and 2015 to reduce the budget deficit to under
3% of GDP by 2015. These will consist of additional spending cuts of
some �3.3 billion and tax increases of �1.8 billion."
the underlying balance in 2012 is -13.5bn. If
�underlying deficits�
(deficits excluding direct payments to banks) then the difference
between -19.18bn and
-13.5bn = -5.68bn, then presumably 5.68bn
was given to the banks.
If the -13.5bn 'underlying' deficit in 2012 was made up of -6.8bn
[Primary Balance] and -6.7bn [Cash Interest] then we can see that
interest repayments grew to become 50% of the deficit compared to 2008
when the Primary Balance was -10.8bn and the Cash Interest -2.4bn.
In other
words, as we borrow money to cover the deficit, then a larger and larger
percentage is being borrowed just to pay the interest on the debt.
If we look at the deficit figures projected for 2014
we can see that all the money to be borrowed, 8.3bn, is to be spent on
interest repayments.
In 2015 it is projected that all the money
borrowed, 5bn, will pay for some of the interest repayments with tax
revenue covering the rest.
A promissory note is a legal instrument (more particularly,
a financial instrument), in which one party (the maker or
issuer) promises in writing to pay a determinate sum of
money to the other (the payee), either at a fixed or
determinable future time or on demand of the payee, under
specific terms.
The Irish Times
Oct 10, 2013
'Promissory note law
could involve �limitless� public monies'
Note in favour of EBS provides
Minister can adjust sum paid upwards or downwards, court
told
"The Minister for Finance used powers under a 2008
�emergency� law to create a promissory note in 2010 which
can be adjusted to allow for the payment of �possibly
limitless� amounts of public monies, the High Court was told
today.
John Rogers SC said the promissory note issued in favour of
the Educational Building Society, under which �250 million
was paid to the Society earlier this year, provides the
Minister can adjust the sum to be paid either upwards or
downwards and permits the creation of �very significant,
possibly limitless� liabilities for the taxpayer.
The sums involved were certainly not predictable when the
note was created in June 2010, he added.
Mr Rogers was continuing his arguments on behalf of United
Left TD Joan Collins in the continuing hearing of her
challenge to the making of promissory notes in 2010 in
favour of Anglo Irish Bank, EBS and Irish Nationwide
Building Society as part of the �31 billion capitalisation
of those institutions.
Ms Collins argues the making of the notes, under the
provisions of the Credit Institutions Financial
Stabilisation Act 2008, which he said appeared to have been
�emergency� legislation, was unlawful because it involved
the Minister appropriating public monies for expenditure
when, under the Constitution, such �appropriation� was
solely a matter for the D�il.
The State denies the claims and argues the TD�s case is
based on a fundamental misunderstanding of the relevant
constitutional provisions.
The court has heard, following the liquidation of Irish Bank
Resolution Corporation (formerly Anglo) last February, that
the �25 billion promissory note issued to that bank was
exchanged for Government bonds due to mature after periods
of between 25 and 40 years.
Mr Rogers argued today, given his side�s claim the
promissory notes are illegal, those bonds cannot be valid.
Because the action raises important constitutional issues
with implications for the entire basis of the State�s
funding, it is being heard by a three-judge court comprising
Mr Justice Peter Kelly, Ms Justice Mary Finlay Geoghegan and
Mr Justice Gerard Hogan.
A government bond is a bond issued by a
national government, generally with a promise to pay periodic interest
payments and to repay the face value on the maturity date.
Government bonds are usually denominated in
the country's own currency.
Bonds issued by national governments in
foreign currencies are normally referred to as sovereign bonds, although
the term "sovereign bond" may also refer to bonds issued in a country's
own currency.
The terms on which a government can sell bonds depend on how
creditworthy the market considers it to be. International credit rating
agencies will provide ratings for the bonds, but market participants
will make up their own minds about this.
Treasury Bond
Issue Date
Maturity Date Coupon Date
ISIN Code
4.6% 2016
11 May 1999 18 Apr. 2016
18 Apr.
IE0006857530
OFFERING CIRCULAR
National Treasury Management Agency
4.60% Treasury Bond 2016
Issue to take place on 11th May, 1999
See Overleaf for Conditions
ISIN Code: IE0006857530
National Treasury Management Agency
10th May, 1999
OFFERING CIRCULAR
CONDITIONS ATTACHED TO THE 4.60% TREASURY BOND 2016
The principal and interest of the above bond, which is
issued under the authority of the Finance Act, 1970 and
other statutes, will be charged on the Central Fund.
Purpose of Issue: The proceeds of the issue will be used
for general financing purposes of the Exchequer.
Trustee Status: The bond is an authorised trustee investment
and trustees may invest in the bond even if the price at
time of investment exceeds the redemption value of �100 per
cent.
Taxation: Interest on the bond will be paid gross without
deduction of income tax or any other deductions or
withholdings.
In general, where the holder of the bond is an Irish
resident taxpayer, the interest element payable on the bond
is assessable to income tax, whereas any gains arising on
disposal of the bond are exempt from capital gains tax.
However, where the bond holder resident in Ireland is
dealing in Government bonds as part of a trade, he/she is
assessable to income tax or corporation tax, as the case may
be, in respect of the interest element and also the gains
arising on disposal or on redemption of the bond.
Section 43 of the Taxes Consolidation Act, 1997 provides
that the bond and the interest payable thereon is exempt
from all Irish taxation so long as it is shown that the bond
is in the beneficial ownership of a person not ordinarily
resident in Ireland. However, where the bond is held by or
for an Irish branch or agency of a foreign financial
concern, interest and gains on such stock will be chargeable
to tax.
Individual purchasers should note that, where the bond is
the subject of a gift or inheritance, the conditions for
exemption set out in Section 57 of the Capital Acquisitions
Tax Act, 1976, as amended by Section 40 of the Finance Act,
1978 are met.
In addition, the execution of instruments for the issue and
the transfer of the bond will be free of Irish stamp duty.
Interest: Interest on the bond will be paid annually on 18th
April. The first interest payment will be made on 18th
April, 2000 and be at a rate of 4.2732%. Interest payable
will be calculated in accordance with the �actual / actual�
day count convention.
The interest payable on each interest payment date will be
based on the balance in the account (s) on the register
maintained by the Central Bank of Ireland, as at close of
business on the preceding business day.
Principal: The principal of the bond will be repaid at par
on 18th April, 2016.
Account: It is a condition of this bond that registered
holder(s) shall nominate an account in a credit institution
linked to the European System of Central Banks� Payment
System (TARGET) into which all dividend/redemption payments
will be made. Details of the account to which such payments
are to be made must be provided to the Central Bank of
Ireland (as Registrar) on the appropriate form, which is
available from the Bank, by close of business (5.00pm) on
the day of registration of the holding. Holders must notify
the Registrar of any change in account details through
completion and lodgment of a further copy of the form.
Registration and Transfer: The register of holders of this
bond issue will be kept at the Central Bank of Ireland.
Stock Certificates shall not be issued. Transfer of
ownership will be evidenced by book entry in the register of
holders held by the Registrar in any sums which are
multiples of one cent.
Stock Exchange Listing: The bond will be officially listed
on the Irish Stock Exchange.
What is an ISIN? An International Securities Identification Number (ISIN)
uniquely identifies a security. Its structure is defined in
ISO 6166. Securities for which ISINs are issued include
bonds, commercial paper, stocks and warrants. The ISIN code
is a 12-character alpha-numerical code that does not contain
information characterizing financial instruments but serves
for uniform identification of a security at trading and
settlement.
http://en.wikipedia.org/wiki/International_Securities_Identification_Number
Thursday, 27 December 2012
THE DIRTY DOZEN w/e Dec 30th 2012
"Final week of 2012 and boy, was it a good year to be bondholder in
an Irish bank. The last of the �20+ billion will be paid out this
Friday, Dec 28th, a bond of nearly �40 million, unsecured, from Bank of
Ireland - more very happy failed punters cashing in at our expense. I
wonder, whatever happened to that much trumpeted separation of bank and
sovereign debt agreed to last June?
Anyway, Happy New Year to you all, though that much is already
guaranteed for those whose bonds 'mature' in 2013, �17bn in total in
2013. Add that to the �9bn in government bonds that fall due in 2013,
throw in the projected budget deficit of �14.5bn and lads - we'd better
get down to work. That's a hell of a lot of additional debt on top of
the debt we already have, don't ye think?"
'AIB repays �1 billion to unsecured
bondholders today'
More than �18 billion has been repaid
to bondholders by state-owned Irish banks this year.
"BAILED-OUT ALLIED Irish Banks (AIB) will
today repay �1 billion in unsecured debt to senior bondholders.
In a move effectively financed by the State, the money will bring to
more than �18 billion the amount that Irish banks have repaid to
bondholders this year as a result of the bank guarantee introduced in
2008.
It is the last payment that is due to AIB, which is 99.8 per cent owned
by the State, this year but there will be a number of other payments
made to unsecured bondholders in State-0wned banks before the end of the
year.
Another �2 billion is due to bondholders before the end of the year in
Anglo Irish Bank, Bank of Ireland, EBS building society, and Irish Life
and Permanent. A further �17 billion will be handed over next year.
Protesters from Sinn F�in and the Campaign against Household and Water
Taxes are due to demonstrate against the bond repayment in Dublin later
today.
Independent TD Stephen Donnelly, who has been heavily critical of
bondholder repayments, has been handing out �1 billion notes at Dart
stations in Dublin today in a bid to highlight the issue.
The notes, which were produced in conjunction graphic designer Con
Kennedy, feature Finance Minister Michael Noonan on the front and a
brief note explaining what is happening on the back."
"The Government agreed, on 28 November
2010, to a three-year �85 billion financial support programme for
Ireland by the EU and IMF. The State�s contribution to the programme
will be �17.5 billion while the external support will amount to �67.5
billion.
The external support under the programme comprises:
�22.5 billion from the IMF Extended Fund Facility;
�22.5 billion from the European Financial Stabilisation Mechanism; and
�22.5 billion from the European Financial Stability Facility (�17.7bn)
and bilateral loans from the United Kingdom (�3.8bn), Sweden (�0.6bn)
and Denmark (�0.4bn)."
The Irish people will be paying back EU
loans until 2042 and IMF loans until 2023
'What
the IMF � EU Bailout for Ireland means in detail!'
"The facility will be made up as follows:
�35 billion to support the banking system;
�10 billion for the immediate recapitalisation and
�25 billion will be provided on a contingency basis.
�50 billion will be provided to cover the financing of the State."
"Prior to the guarantee in September
2008 the quantity of bonds was beginning to decline. This continued up
until the summer of 2009 after which there was a stabilisation, and even
a slight increase, in the bonds in issue.
By April 2010 there was �111 billion of
bank bonds (actually �6 billion more than in September 2008), but by the
end of 2010 this had fallen to �64 billion � a drop of over �47
billion. Most of this money was fully repaid."
"So who got the money? The Central Bank
breaks the total down by Irish, Other Eurozone and Rest of the World
residents.
The biggest drop has occurred for
bondholders from the rest of the world which stood at �74 billion in
August 2008 and has dropped (or been repaid) by such an extent since the
guarantee was introduced that it is now down to �20 billion.
A drop of �54 billion since August 2008.
As late as last August there were �41 billion of bonds held by rest of
the world residents but there was a reduction of �17 billion in
September."
"Irish residents have seen their
holdings of Irish bank bonds rise from �25 billion at the time of the
guarantee to �45 billion in April 2010.
Since then, these too have fallen and
were down to �33 billion by December [2010].
The proportion of bond held by Irish
residents has been rising since the guarantee was introduced and now
stands at just over 50%. Are we going to burn ourselves?
Since the guarantee holdings of Irish
bank bonds by other Eurozone residents has fallen from �17 billion to
�10 billion. This would hardly leave a ripple on the European banking
system.
This would similarly apply to the �20.5
billion held by residents of the rest of the world. Non-payment of the
�33 billion owed to Irish residents would be far more significant."
Domestic ownership of Irish
government bonds rises from 28% to 48% since 2012
By Finfacts Team
Aug 13, 2014 - 3:01 PM
The domestic ownership of Irish government bonds rose from 28% at end
2012 to 48% in June 2014 and the biggest factor was the Central Bank's
2013 deal on the promissory note debt of ex-Anglo Irish Bank (renamed
IBRC) -- see NTMA profile here - - the 2013 IBRC Promissory Note
repayment (non-cash settlement) resulted in �25bn of long-dated
Government bonds being issued to the Central Bank of Ireland on
liquidation of IBRC.
The Central Bank said today that outstanding government bonds stood at
�113.21bn in June 2014, with 11% due to mature in less than three years.
At end-June 2014, resident holders held 47.7% of long-term Irish
government bonds. resident credit institutions and the Central Bank of
Ireland, account for 91% of resident holdings.
At the end of 1999, over 70% of Irish bonds were held by domestic
investors with the balance in the hands of overseas investors. At end
2011 78% of Ireland�s MLT securities were held overseas according to the
NTMA - the debt agency.
The resident non-bank financial sector reported holdings of �2.76bn in
June 2014. The holders within this sector were predominately other
financial intermediaries at �1.13bn (Chart 1).
32% of outstanding Government bonds will mature within the next 5 years.
27% of resident holders fall under this maturity category, while the
equivalent ratio for non-resident holders is higher at 37%. Furthermore,
30% (or �17.7bn) of long-term bonds held by non-resident investors will
mature from 2023 onwards (Chart 2).
'Noonan to meet Troika after Budget to discuss
bailout exit'
12 October 2013
"FINANCE Minister Michael Noonan has hinted that
Ireland might not have to apply for a precautionary credit line when it
exits the bailout.
The Government has already indicated it might look for a �10bn credit
buffer to guard against market shocks.
But Mr Noonan told the Fine Gael national conference the National
Treasury Management Agency (NTMA) has built a �25bn fund which can act
as a significant buffer after Ireland exits the bailout.
"If we never borrowed another bob, we're cash-funded into 2015," Mr
Noonan said.
He was echoing similar comments made by EU economics commissioner Olli
Rehn this week, who said Ireland might be able to exit the bailout
without a �precautionary arrangement�.
Mr Noonan said he will start consulting with the Troika after the Budget
on how to manage Ireland�s exit from the bailout.
�Countries who have exited IMF Programmes have had follow up programmes
or backstop arrangements to ensure a return to the markets at very
little risk,� he said.
�Ireland is fortunate that the NTMA has almost �25 billion in cash
balances as we return to the market so we have a backstop already in
place."
"The National Treasury Management Agency (NTMA) is
presently sitting on a cash mountain of nearly �25bn. It places it on
deposit in the Central Bank of Ireland and receives interest at a rate
of just 0.1% per annum � yes, just zero point one per cent! The �25bn is
either borrowed or could be used to pay down borrowings which cost us an
average of 3.5% per annum. In other words, this State is sitting on a
cash mountain costing us �875m a year in interest and if you deduct the
�25m we get from the Central Bank, in net terms this mountain of cash is
costing is �850m! Per Year!
Now, there is a reason why the NTMA does keep a cash reserve. Ireland is
in a precarious financial position with a general government deficit
over �10bn per annum and our deficit: GDP was about 8% in 2012 which is
horrendous. And at the end of 2013, the funding from the �67.5bn
external bailout from the so-called Troika comes to an end. And we have
colossal borrowings which we need to repay � previously issued bonds and
repayments to the Troika.
So the NTMA calculates that it needs some reserve or buffer. It
calculates that if markets know there isn�t such a buffer, then those
markets will demand higher rates of interest than they otherwise would
on new issuance of bonds. Which all seems rational.
So, we�re buying insurance for the funding of the State which is costing
us �850m per annum."
"The State's debts are already intimidating, approaching
�200bn gross, with the risk of further liabilities emerging in the banks
and huge unfunded pension liabilities. It is easy to forget that the
State owns some financial assets too, mainly a large pile of cash (about
�25bn) resting in the accounts of the Exchequer.
The cash, on deposit at tiny interest rates, arises because the
government borrows in advance of actual requirements. The cash pile is
surprisingly large right now, reflecting bond issues by the National
Treasury Management Agency, which pays market interest rates when it
borrows but earns substantially less on the funds deposited. This brings
peace of mind but at serious cost - if more modest cash balances were
chosen, there would be an interest saving running to several hundred
million per annum.
It is not irrational to be a debtor while keeping cash on hand, up to a
point. The gap between what you pay to borrow and what you earn on
deposit is called the negative carry and is now up to three and four
percent per annum on some of the cash pile."
Ajai Chopra and an IMF delegation pass Anton
Rostas from Romania as they make their way to the Central Bank
for crucial talks with the government in Dublin on November 18th, 2010.
Photograph: Peter Morrison/AP
What is the Troika?
"The term Troika, which comes from the Russian meaning 'group of three',
was increasingly used during the eurozone crisis to describe the
European Commission, International Monetary Fund and European Central
Bank, who formed a group of international lenders that laid down
stringent austerity measures when they provided bailouts, or promises of
bailouts for indebted peripheral European states � such as Ireland,
Portugal and Greece � in the financial crisis."
"Capital markets are financial markets for the buying and selling of
long-term debt- or equity-backed securities. These markets channel the
wealth of savers to those who can put it to long-term productive use,
such as companies or governments making long-term investments. Financial
regulators, such as the UK's Bank of England (BoE) or the U.S.
Securities and Exchange Commission (SEC), oversee the capital markets in
their jurisdictions to protect investors against fraud, among other
duties.
Modern capital markets are almost invariably hosted on computer-based
electronic trading systems; most can be accessed only by entities within
the financial sector or the treasury departments of governments and
corporations, but some can be accessed directly by the public. There are
many thousands of such systems, most serving only small parts of the
overall capital markets.
Entities hosting the systems include stock exchanges, investment banks,
and government departments. Physically the systems are hosted all over
the world, though they tend to be concentrated in financial centres like
London, New York, and Hong Kong. Capital markets are defined as markets
in which money is provided for periods longer than a year.
A key division within the capital markets is between the primary markets
and secondary markets. In primary markets, new stock or bond issues are
sold to investors, often via a mechanism known as underwriting. The main
entities seeking to raise long-term funds on the primary capital markets
are governments (which may be municipal, local or national) and business
enterprises (companies).
Governments tend to issue only bonds, whereas companies often issue
either equity or bonds. The main entities purchasing the bonds or stock
include pension funds, hedge funds, sovereign wealth funds, and less
commonly wealthy individuals and investment banks trading on their own
behalf. In the secondary markets, existing securities are sold and
bought among investors or traders, usually on an exchange,
over-the-counter, or elsewhere.
The existence of secondary markets increases the willingness of
investors in primary markets, as they know they are likely to be able to
swiftly cash out their investments if the need arises.
A second important division falls between the stock markets (for equity
securities, also known as shares, where investors acquire ownership of
companies) and the bond markets (where investors become creditors)."
'Getting
ready for a successful return to the bond markets'
'The NTMA�s John Corrigan is cautiously optimistic about Irish plans to
tap the market'
One of the key issues facing Ireland post bailout is whether we can
achieve regular access to capital markets at sustainable interest rates
to enable the Government to continue to meet the day-to-day running
costs of the country.
We were locked out of markets in 2010 when the coupon on Irish sovereign
bonds became unaffordable and the country was forced into raising �67.5
billion from the EU and IMF via a bailout programme.
Three years on, and the National Treasury Management Agency is poised to
re-enter capital markets on a regular basis.
It has already had some success. In January it raised �2.5 billion in a
bond that will mature in 2017. The interest rate was 3.32 per cent. In
March the NTMA issued a 10-year bond at 4.15 per cent. This was the
first 10-year issue by the agency since January 2010, and reflected
improved sentiment towards Ireland as the economy continued to repair
itself slowly and the country complied with the conditions of the troika
bailout.
With Ireland exiting the bailout this month without the safety net that
a precautionary credit line might have provided, what are the NTMA�s
plans to tap the market in 2014?
Agency chief executive John Corrigan says we will have about �20 billion
in the kitty by the end of December. In addition, around �800 million
remains to be drawn down from the troika early in the new year.
�That should keep us going well into the first quarter of 2015,� he
says.
Bond redemption
Among other things, it will be used to meet a bond redemption in January
for just shy of �7 billion.
Next month will see the NTMA reveal its plans for fundraising next year.
�We�ll probably issue between �6 billion and �10 billion [next year],�
Corrigan explains. �We�ll announce in January what the complexion of
that is likely to be. Ideally, it will involve some auctions during the
course of 2014 because the challenge is achieving a regular return to
the markets on a sustainable basis.
�We raised �7.5 billion in the bond markets [in 2013] but that funding
was on an opportunistic basis. We sort of jumped out of the bushes when
we thought it was right. We need to get into a pattern that shows we
have regular access. That�s the key.�
The NTMA plans to meet with primary dealers in London this month to
gauge their views on Ireland�s return to capital markets. �It�s the
primary dealers who are dealing with the markets on a day-to-day basis.
They know what�s likely to travel. If we were to do a syndicated issue
in 2014 . . . five or so primary dealers would be drawn from this group
[in London].�
There will also be trades in short-term treasury bills, or T-bills as
they are better known. These are typically �500 million in size with
three-month maturities. Corrigan describes them as �tactical funding�.
Economy crashed
Irish bond yields are currently around 3.5 per cent, below the 4-4.5 per
cent level that we would have been paying before the economy crashed
when we were an AAA-rated country. This reflects the current low
interest rate environment globally. �What that tells you is that the
bond markets are dislocated for all the reasons that are well
rehearsed,� he says. �So it makes sense to lock in at the longer end
[longer-dated debt].�
Corrigan is more interested in the spread over German yields, which is
about 175 basis points. This is the risk premium attaching to Ireland at
present. �The spread of 175 over Germany is not for nothing. It�s not a
risk-free investment.�
Will the NTMA move early in the new year to secure funding while
interest rates are so low? �We�ll have to wait and see. You have to be
very sure-footed. You never say you�re going until you�re absolutely
certain you�re going.�
A key issue in a successful return to the markets would be a re-rating
by Moody�s of Ireland to investment grade. In September Moody�s changed
its outlook on Ireland�s sovereign rating to stable from negative but
stopped short of moving us from its Ba1 sub-investment grade, which
Corrigan says would have a number of benefits for us. We�re just one
notch away.
�It�s very important. The Asian investors, where we would have had a
good following [before 2008], have been largely sidelined by the fact
that Moody�s has us at sub-investment grade. And there are odd pockets
of investors around Europe as well whose mandates from clients would
only allow them to invest when the credit rating is investment grade
from the three main rating agencies. That�s the typical investment
mandate that you have in Asia and the Far East.�
The NTMA has been pounding the pavements in the past two months in Asia
selling the Irish story to investors. �Certainly there�s appetite and
it�s the marginal investor that can help your yield . . . so it is
important.�
Moody�s recently moved Portugal to a stable outlook and its eurosceptic
view appears to be softening. �We see that as a positive,� says
Corrigan. �It wasn�t necessarily conditions in Ireland that were holding
back Moody�s but they had a take on the euro zone as a whole that was
sceptical. We would be quietly hopeful.�
The NTMA has used Minister for Finance Michael Noonan to help sell the
Irish recovery story overseas. He regularly pops up on Bloomberg TV for
interviews and attends investor sessions where possible.
Fitch was the first ratings agency to soften its view of Ireland and
Corrigan believes the Minister�s appearance at a meeting with them in
Washington DC helped to seal the deal.
�He�s a straight talking man. That�s one of the small-country advantages
that we have. Ratings agencies wouldn�t normally get access to the
finance minister as they would with Ireland.�
It�s not all honey and jam. The general government debt is estimated to
stand at �206 billion by the end of this year or 124 per cent of GDP.
The cash interest cost of the national debt this year will be about �7.2
billion, rising to �8.2 billion in 2014.
What are the challenges that could scupper Ireland�s return to regular
market funding?
�There�s a lot of uncertainty still remaining in the euro zone, although
the white heat surrounding it has calmed down.
�We also have to see the unwinding of the quantitative easing in the
United States, and we saw a trailer earlier this year of how the market
might react if it�s not handled carefully.
�Then we have the [euro zone] bank stress tests towards the back end of
2014. The deferral of the [Irish] stress tests to coincide with the euro
zone-wide stress tests was seen as a positive by the investment
community because it meant we weren�t being picked for special
treatment. Nonetheless, there�s a risk there.
Primary surplus
�I don�t believe we�ll have an issue accessing the funds. The question
is over time to continue to run a primary surplus that will get the
debt-to-GDP level down to what is more acceptable to capital markets.
We�re committed to doing that anyway under the various EU protocols but
that would reflect itself then in a narrowing of the spread [with German
bonds].�
Corrigan has no regrets about the decision to exit the bailout without a
precautionary credit line in place.
�We didn�t need it anyway because if you got a credit line it only
applies for 12 months. We have the cash in the bank [for the next 12
months],� he says.
Hasn�t he changed his tune? After all, only a few months ago he was
talking about it being a �good club� for Ireland to have in its golf
bag.
�We would have discussed this with investors and with the ratings
agencies and they were very relaxed about it. They see us as having been
put through the ringer with stress tests and other troika measures.
�They see us as having delivered on most if not all of the troika
measures and we are in relatively good health.
�But we are cautious people and that prompted me to say that it would
have been a nice club to have in the bag. Overall, I think we�re in a
good place and have a good story to tell.�"
Trichet
letter revealed: ECB threatened to stop emergency funding unless Ireland
took bailout
Exclusive: �Secret� letter obtained by The Irish Times shows Brian
Lenihan was told to seek bailout
(The Irish Times - Nov 6, 2014)
The European Central Bank (ECB) explicitly threatened in late November
2010 to cut off emergency funding from the Irish banking system, unless
Ireland immediately applied for a bailout and agreed a programme of
austerity and bank recapitalisation.
The letter from then ECB president, Jean-Claude Trichet, to former
finance minister Brian Lenihan � marked �secret� � was sent on November
19th, 2010. A copy has been obtained by The Irish Times. Its publication
is due to be considered at a meeting of the ECB governing council today.
The letter states that the governing council of the ECB would only agree
to provide further emergency liquidity assistance (ELA) to the banks if
it received �in writing a commitment� from the government to apply
immediately for a bailout.
It said that the request for financial assistance had to contain a
commitment to budget cutbacks and a restructuring of the financial
sector.
Also, it said that the restructuring plan must include the provision of
the necessary capital to the Irish banking system and that the
government had to agree to underwrite the repayment of the ELA to the
Central Bank.
ELA was special funding provided to the banks who no longer were able to
draw down normal ECB lending. Around �50 billion had been extended to
Irish banks at the time � with additional funds approved by the ECB the
day before.
A failure to continue this funding would have threatened their ability
to stay open and provide cash to the public.
Swift response
The letter was sent the day after Central Bank governor Patrick Honohan
appeared on Morning Ireland to say Ireland had no option but to apply
for support. The ECB letter called for a �swift response� from the
government.
Two days later, on November 21st, the formal application for the bailout
was made.
The ECB council was due to consider the publication of the letter today,
and it is thought they may also release earlier correspondence.
The ECB would be expected to argue that its financial exposure to
Ireland and the risk that the money would not be repaid left it with no
option but to try to secure its position. Critics will say that the ECB
overstepped the mark in dictating to the government.
'Blog: The Troika's leaving, but we're under their thumb until 2034'
"It's often
overlooked but the Troika's entry to Ireland - and the terms
and conditions of the subsequent Memorandum of Understanding
between Ireland and its paylords - followed the negotiation
of the national Stability Programme with the European
Commission. That's the deal responsible for the 'Four Year
Plan' - where the general framework of every Budget until
2014 - was originally mapped out.
That programme - and bear with me here, because this is
where the terminology gets bonkers - is because Ireland is
currently knees-deep in an 'Excessive Deficit Procedure' (EDP).
In short, the gap between Ireland's income and its spending
became so pronounced in 2008 and 2009 that the European
Commission stepped in to take an overseeing role in how bad
we were doing. A slow process
The EU's rules dictate that this happens when the budget
deficit (i.e. the gap between spending and income) exceeds
3% of the total size of Ireland's economy. Basically - under
treaties Ireland has voted to accept - the Commission gets
to hang around and have input into the Budget process until
we get the deficit below 3% again. This year it'll clock in
at around 7.5%; next year it should be about 4.8%, and all
going well we'll make it to 3% in 2015.
But all of this means the Commission still gets a hands-on
role in scrutinising the shape of Budget 2015 until we get
back to the 3% mark. At current rates, that'll mean an
eighth successive austerity budget with adjustments of
around �2.5bn.
And it's not over there. That 3% rule I just mentioned?
Those goalposts were moved last year.
The Fiscal Compact (approved in a referendum last year)
essentially requires every member state to limit their
deficit to just 0.5% of the size of their economy. Ireland
will get a few years' grace but we'll have to fall into line
with that total by 2018 or 2019 at the latest. That means
another three years of belt-tightening after 2015 before
we're aimed at the new goalposts.
And wait: that's not even the half of it. Did you know you
moved the goalposts?
Earlier this year the EU adopted the latest In a series of
new rules on financial control, known as the 'two pack'. Its
most potent symbol is the fact that the Budget is now
announced in October, so that the European Commission has
two months to scrutinise the figures.
Part of those rules dictate that countries emerging from an
EU-IMF bailout have to open themselves to a little bit of
extra scrutiny. In the EU's own words:
Until they have paid back a minimum of 75% of the
assistance received, they will remain subject to new
enhanced surveillance. This is to ensure a successful and
durable return to the markets as well as fiscal
sustainability, to the benefit of the individual Member
State concerned as well as the euro area as a whole.
[See:
http://europa.eu/rapid/press-release_MEMO-13-457_en.htm]
And this is the killer. If you go to the NTMA [National
Treasury Management Agency]
website you'll see a list of the loans we've
got from the two European bailout funds so far. Noting the
repayment date for each (and adding seven years to each of
the EFSM [European Financial Stabilisation Mechanism]
repayment dates, because they haven't yet finalised the
extention to the repayment period), this is the schedule we
get for the EU side of things: [see table above].
The line I've shaded in is the important one. If Ireland
stopped borrowing from the EU this instant, and went back to
the market of its own volition, it would take until
September 2034 to repay the requisite 75%.
And even then, because of the other two-pack rules, the
Budget will forever have to be sent to Brussels for its
final sign-off before it can be put into action.
So we might be saying goodbye to the Troika today... but
we'll be welcoming the European Commission for further
scrutiny for another two decades at the very least.
"�30.7 billion in promissory notes of which
two installment payments have been made (or one made and one
kinda-sorta-maybe made depending on your point of view) with many more
to come.
�20.7 billion from the NPRF has been invested in acquiring ownership
stakes in AIB and Bank of Ireland.
�11.4 billion of additional exchequer resources have been spent on IBRC,
AIB and ILP [Irish Life and Permanent]."
The Irish Bank Resolution Corporation (IBRC)
was the name given to the entity formed in 2011 by the court-mandated
merger of the state-owned banking institutions Anglo Irish Bank and
Irish Nationwide Building Society.
Formed on 1 July 2011, following a High Court order on the application
of the Minister for Finance Michael Noonan, the Irish government drove
through overnight legislation to liquidate it in February 2013.
What Is Ireland�s Bank Debt? Karl Whelan June 2012 "The figure of �64
billion has been widely circulated as the cost of bailing
out Ireland�s banks. The answer [from Michael Noonan]
contains a handy table [above] and it shows the total figure
at the slightly-lower �62.8 billion. Of this, �34.7 billion
was supplied to the institutions that comprise the IBRC,
while the other �28.1 billion was spent recapitalising and
acquiring full ownership of AIB/EBS and Irish Life and
Permanent and acquiring preference shares and a minority
ordinary shareholding in Bank of Ireland.
IBRC was recapitalised with �30.7 billion
in promissory notes and �4 billion in exchequer resources. �20.7 billion
from the National Pension Reserve Fund was used to acquire preference
and ordinary shares in AIB and Bank of Ireland. Additional exchequer
resources were used to spend �4.7 billion on AIB and �2.7 billion on ILP."
Summary explanation for AIB, Bank of Ireland and
IL&P (Caoimhghin � Croidhe�in)
�20.7 billion from the National Pension Reserve Fund was used to acquire
preference and ordinary shares in AIB and Bank of Ireland plus
additional exchequer resources were used to spend �4.7 billion on AIB.
[�20.7bn + �4.7bn = �25.4bn]
The government invested �25.4 billion in acquiring
the shareholdings in AIB and Bank of Ireland currently held by the NPRF
[National Pension Reserve Fund].
Additional exchequer resources were used to spend �2.7 billion on
IL&P (Irish Life and Permanent).
[�25.4bn + �2.7bn = �28.1bn]
Total:
The Irish government has invested �28.1 billion in
bank shares [June 2012]
"AIB, Bank of Ireland and Irish Life and
Permanent
The government invested a combined �25.4 billion in acquiring the
shareholdings in AIB and Bank of Ireland currently held by the NPRF. The
NPRF�s latest set of accounts [1st Qtr 2012] values these holdings at
�9.36 billion. Those accounts don�t break down the valuations between
the two banks but these [NPRF] accounts from 2011:Q3 value the holdings
at �9.6 billion, of which �7.1 billion is allocated to the ownership of
AIB. The book value of equity in AIB at the
end of 2011 was �14.6 billion. Given weak operating profits and
ongoing loan loss writedowns, the NPRF valuation looks highly
optimistic.
The government also own Irish Life and Permanent, which had equity with
a book value of �3.5 billion at the end of 2011. Given the bank�s
serious ongoing problems, I�d be surprised if it had a market value much
above zero.
So the Irish government has invested �28.1 billion in bank shares that
are likely worth less than �9 billion now."
How much has Ireland paid for the EU
banking crisis?
Ireland has been declared a �special case� by Angela Merkel � and
these figures show exactly why, writes Michael Taft.
[Jan 2013]
"Yes, there�s wee Ireland up
at the top, just edging out Germany for the dubious title of
spending the most on the banking crisis. �41 billion to date
according to the Eurostat accounting data (this doesn�t
count the billions ploughed into the covered banks from our
National Pension Reserve Fund as this was not counted as a
�cost� to the General Government budget).
The European banking crisis
is just that � a European crisis. But as we know, this has
not been addressed at European level. Rather, the cost has
been delegated to individual countries regardless of their
size or ability to pay. For instance:
Ireland makes up 0.9 percent of the EU population
The Irish economy makes up 1.2 percent of EU GDP
Ok, we�re small. So how much of the entire European banking
debt have we paid?
The Irish people have paid 42 percent of the total cost of
the European banking crisis.
The European banking crisis to date has cost every
individual in Ireland nearly �9,000 each. The average
throughout the EU is �192 per capita. I really don�t know
what you can say after that.
But if are still paying
nearly �9,000 each while the remainder of the EU pays only a
fraction of that, then it is no deal at all; just a
re-arranging of euro notes � a lot of euro notes � on the
decks of a sunken ship."
Shareholders and creditors to pay for
banks' mistakes, not taxpayers
The Bank Restructuration and Resolution directive sets
new rules for all 28 Member States to put an end to the old paradigm of
bank bail-outs, which cost taxpayers' hundreds of billions of euros in
the crisis. For the first time, it enshrines in binding rules the
principle of bail-in so that shareholders and creditors pay for banks'
mistakes, not taxpayers. Any additional funds exceptionally required
will come from the banking sector itself in the shape of specially set
up resolution funds.
Banking Union:
We want bail-in of creditors and investors to be applied in the same way
to all banks
According to Dutch
MEP Corienn Wortmann-Kool this will create a resolution
process that would treat banks equally regardless of country
they were based in. �We want bail-in of creditors and
investors to be applied in the same way to all banks
irrespective of the member states these banks are located
in,� she said using the example of Ireland as compared to
larger states such as Germany and France.
While the plan agreed in December would have meant that a
French or German bank, for example, with a large fund behind
them would have been able to implement a moderate bail-in,
an Irish bank with a smaller national fund would be forced
into a deeper bail-in, leading to higher funding costs, she
said.
Dan White: Be prepared for more economic
stress as banks are put to the test
Published 29/04/2014|14:34
The dire condition of many of Europe�s major
banks is one of the key roadblocks to any economic recovery in the
Eurozone.
It isn�t just the Irish banks which are stuffed to the gills with bad
loans.
This is a continent-wide problem � one that if it isn�t addressed could
blow the single currency apart.
So what are the chances of any of the Irish-owned banks failing the
stress tests?
In 2011 all three, AIB, Bank of Ireland and Permanent TSB, passed.
Why should it be any different this time?
Well, when considering the stress tests the important thing to remember
is that, while they are being dressed up as being utterly impartial and
objective, the reality is of course very, very different.
It is utterly inconceivable that one of the really big Eurozone banks,
Germany�s Deutsche Bank, Societe Generale in France, Santander in Spain
or Unicredit in Italy, will be allowed to fail.
CAPITAL
The political and financial consequences of one of the big boys having
to go cap in hand to their governments for extra capital simply don�t
bear thinking about.
This means that it ain�t going to happen � no matter how many bad loans
are found to be lurking in their balance sheets.
However, if the stress tests are to retain any shred of credibility then
some big(ish) names have to be seen to fail.
Now call me a cynical old so-and-so but is it beyond the bounds of
possibility that one or more of the Irish banks would be marked down?
After all, someone has to be made an example of.
From an EU perspective failing one or more of the Irish banks would help
give the stress test results some much-needed credibility � while not
endangering the stability of any of the really large Eurozone banks.
But if, for example, either AIB or Bank of Ireland were to fail a stress
test such an outcome would almost certainly shatter confidence in
Ireland making it, at the very least, far more expensive for the
government to sell bonds to investors on the international financial
markets.
With the government having already borrowed �210bn on our behalf, an
increase in the interest rate which we pay on our bonds is the last
thing we need.
So will the Irish banks pass the stress tests?
ARREARS
Between them the Irish-owned banks have over �30bn of mortgages that are
either in arrears and/or have been restructured on their books and at
least a further �15bn of non-performing loans to SMEs.
Throw in other lending, credit cards, overdrafts, personal loans etc.,
and the total of distressed loans climbs to well over �50bn.
Wall Street Shadow
Banking: You Can�t Taper a Ponzi Scheme: �Time to Reboot� By
Ellen Brown
Among those hot topics was the runaway shadow
banking system, defined by Investopedia as �The financial
intermediaries involved in facilitating the creation of
credit across the global financial system, but whose members
are not subject to regulatory oversight. The shadow banking
system also refers to unregulated activities by regulated
institutions.� Examples given include hedge funds,
derivatives and credit default swaps.
Conventional banks also engage in �shadow banking.� One way
is by using their cash cushion as collateral in the repo
market, where they can borrow to invest in the stock market
and other speculative ventures.
the derivatives pyramid has continued to explode under its
watch, to a notional value now estimated to be as high as $2
quadrillion.
One reason rates are unlikely to be raised is that they
would make the interest tab on the burgeoning federal debt
something taxpayers could not support. Higher rates could
also implode the monster derivatives scheme.
Michael Snyder observes that the biggest banks have written
over $400 trillion in interest rate derivatives contracts,
betting that interest rates will not shoot up. If they do,
it will be the equivalent of an insurance company writing
trillions of dollars in life insurance contracts and having
all the insureds die at once. The banks would quickly become
insolvent.
Worse, our deposits would get confiscated to recapitalize
them, under the new �bail in� scheme approved by Janet
Yellen as one of the Fed�s more promising tools (called
�resolution planning� in Fed-speak).
The European Union financial
transaction tax (EU FTT)
The European Union financial transaction tax (EU FTT) is a
proposal made by the European Commission to introduce a
financial transaction tax (FTT) within some of the member
states of the European Union initially by 1 January 2014,
later postponed to 1 January 2016. The tax would impact
financial transactions between financial institutions
charging 0.1% against the exchange of shares and bonds and
0.01% across derivative contracts, if just one of the
financial institutions resides in a member state of the EU
FTT.
The tax would be levied on all transactions on financial
instruments between financial institutions when at least one
party to the transaction is located in the EU. It would
cover 85% of the transactions between financial institutions
(banks, investment firms, insurance companies, pension
funds, hedge funds and others). House mortgages, bank loans
to small and medium enterprises, contributions to insurance
contracts, as well as spot currency exchange transactions
and the raising of capital by enterprises or public bodies
through the issuance of bonds and shares on the primary
market would not be taxed, with the exception of trading
bonds on secondary markets.
Irish Congress of Trade
Unions
The Case for a Financial Transaction Tax: A Fair and
Substantial Contribution from the Financial Sector
November 2012
There is plenty of evidence that small
transaction taxes will not only make this sector pay its
contribution, but will reduce the risk of the recurrence of
economic
crises based on speculative bubbles. At the heart of the
argument is the power the financial sector has to ruin the
productive sector of our economy; casino capitalism versus
productive capitalism.
http://www.ictu.ie/download/pdf/the_case_for_the_ftt.pdf
EU financial transaction tax plan at
risk of �withering and dying�
By Ann Cahill - European Correspondent - 6 May 2014
The future of the financial transaction tax, which 11 EU
countries have said they will adopt, is uncertain as finance ministers
meet today.
Ireland has said it is not interested in the tax unless all 28 member
states are ready to adopt it, but is among the countries complaining
about a lack of transparency among the 11 espousing it.
There are reports of huge rows among the countries that have said they
want to adopt the �Robin Hood tax�, including France, Germany, Italy,
and Spain.
One EU source said the disputes had become so significant that, while
the whole project would not be withdrawn, it was in danger of being
quietly forgotten and allowed to �wither and die�.
It is the first tax issue and the third EU initiative being promoted
under the enhanced co-operation initiative that allows a number of
member states to go ahead and agree a measure between them.
Efforts to have all countries adopt a financial transaction tax failed
when put forward by the European Commission in 2010, while the UK last
week failed in its challenge in the European Court of Justice to prevent
the 11 countries continuing proceedings. The yes side has been accused
of holding secret meetings and negotiations, claims that will be
discussed at today�s meeting.
�There is huge tensions,� according to a source. �It is without doubt a
file that has attracted some of the most bitter discussions and
suspicion among member states.�
German chancellor Angela Merkel and French president Fran�ois Hollande
set a deadline of this month � before the European elections � for an
agreement that would see a 0.1% tax on all transactions, including on
hedge funds and high-frequency trading.
�If it is going to happen now there needs to be some kind of agreement �
it needs some political momentum � if it is to go ahead,� said the
source.
Three of the countries already have a financial transaction tax while
the others are considering introducing their own; Portugal has agreed
that its government can create one if it wants.
The danger now, according to some, is that the enhanced co-operation
initiative will be abandoned and each country will introduce their own
tax with no harmonisation.
Ireland has a stamp duty of 1% on some transactions but not necessarily
on those involving hedge funds and fears it will lose traders if it
extend it. It yields more than �200m a year.
According to the European Commission, Ireland would gain more than �500m
a year from a financial transaction tax.
Britain, which is vehemently against a financial transaction tax, also
has a limited stamp duty. It has said it may return to the courts to
challenge any agreement that the 11 counties may reach.
80 per cent - UK-sourced funding in Irish domestic banks
13 per cent - US-based
funding
5 per cent came from
off-shore funding
2 per cent - directly from
the euro zone
'How clueless Irish pundits
misrepresented Germany' The Irish Times 16/9/2013 Credit: Derek
Scally
"Hibernocentric crisis narrative
That Germans saved and Irish spent in the past decade is one of those
sweeping statements rarely challenged from which pundits have
extrapolated their Hibernocentric crisis narrative. The Germans were
effectively buying the drinks for the Irish, they say, and should thus
share the blame, the cost and the consequences for the car now wrapped
around the tree.
The trouble is that the financial data to support this argument is at
best complex and patchy and at worst far less compelling than you might
think.
Last March the Central Bank supplied The Irish Times with previously
unpublished data showing that when the music stopped in 2008 it was
Britain, not Germany, that was by far the biggest source of funding for
Irish banks."
'The money trail . . . How much European,
particularly German, money was in the Irish economy when the music
stopped?' The Irish Times 27/3/2013 Credit: Derek
Scally
"Banking data is compiled along the "nationality concept", ie
attributing data to the country where a bank's headquarters is based.
This method does not always take into account the source of the funds
being invested nor does it take into account indirect investment. German
banks had huge exposure to US and UK lenders who, in turn, were big
lenders to Ireland as well as big losers in the sub-prime debt crisis.
Taking all this into account, establishing the origin of pre-crisis
capital flows to Ireland is a complicated task. Information is patchy,
not everything was collated and not all collated data is publicly
available. Pre-crisis banking data for Ireland seen by The Irish Times
and Die Zeit indicate that direct euro zone lending to Irish banks
before the crisis was unimportant relative to lenders in other
locations.
Euro area figures for Ireland show the top three lending locations to
pre-crisis Irish banks were, in order, the UK, offshore centres and the
US. In 1995, UK funding for Irish banks was 94 per cent of the total
foreign funding; by mid-2008 the UK-sourced funding in Irish domestic
banks was 80 per cent of the total. US-based funding accounted for 13
per cent in 2008, while 5 per cent came from off-shore funding, where
the nationality of investor is not clear. Which leaves 2 per cent of
total Irish bank funding directly from the euro zone.
Funding
Pre-crisis Irish banks funded themselves in four ways: interbank
lending; deposits; debt securities; and other sources. Central Bank of
Ireland statistics for August 2008, the month before the bank guarantee,
show consolidated bank liabilities of 587.648 billion. (See graphic) Of
that total 241 billion (41 per cent) were Irish deposits and securities
(long- and short-term bonds). Some 41.5 billion (7 per cent) were
euro-area deposits and securities. Meanwhile 225.5 billion (38 per cent)
was deposits and securities from the rest of the world, including the UK
and US.
Interbank
Statistics show a rise in euro area funding to Irish banks in the
pre-crisis decade and a sharp reversal in 2007. Irish statistics do not
give a breakdown of interbank flows between banks in Germany and
Ireland, however Bundesbank statistics indicate a growing German
investment. In early 2000, German banks had 20 billion invested in
Ireland, according to consolidated figures. By the end of 2006 that had
quadrupled to 79 billion. By September 2008, the month of the bank
guarantee, the level was 135 billion - a 575 per cent increase compared
to eight years earlier. Investment declined rapidly between September to
October 2010 from 157.5 billion to 78.3 billion. Currently the amount is
51 billion.
The Central Bank of Ireland says Bundesbank data sets relating to
Ireland carry health warnings. A law change in 2001 allowed IFSC-based
non-Irish-owned banks issue covered bonds which impinge minimally on the
Irish domestic bank sector but were still collated in Irish banking
data. Thus Bundesbank data relating to Irish banks is, the Irish Central
Bank warns, distorted by large capital flows of German banks to and from
their IFSC subsidiaries.
Bondholders
Tracking the identity or nationality of bank bondholders is a difficult
task. Purchases are anonymised by a clearing house system and bonds
change hands rapidly. Consolidated Central Bank figures from August 2008
nevertheless provide an interesting snapshot. Debt securities, including
short- and long-term bonds, contributed 107.97 billion to Irish bank
financing a month before the bank guarantee. Of this total, one quarter
of bonds were in Irish hands, while 63 per cent were held outside the
euro area. Euro area banks comprised just 13 per cent of bondholder
total.
Deposits
Of non-resident deposits in August 2008, Central Bank of Ireland figures
show that just 10 per cent came from the euro area. Internal CBI
statistics indicate that German non-bank retail depositors - private
savers - comprised less than 5 per cent of foreign deposits at the Irish
peak in 2008.
Anglo
Blogger Paul Staines caused a furore by publishing a list of what was
purported to be Anglo Irish Bank's pre-crisis bondholders. Of the 80
bondholders on the published list - a small subset of the full book -
about 30 institutions (37 per cent) are German institutions such as
Deutsche Bank and AXA. "It is not a great conspiracy list as it shows
representatives of the bond business and has the names of everyone you
would expect to be there," says Mr Staines now. The spreadsheets on
which he based the published list, he says, show "there was more British
money than German [in Anglo], which didn't exactly serve my argument
that Ireland was bailing out the euro zone"."
Ireland has the second highest percentage of low-paying jobs in the
world
IN A NEW research note on inequality, Morgan
Stanley economist Ellen Zentner included this fascinating chart showing
that, among OECD countries, the United States has the highest proportion
of low-paying jobs, with Ireland not far behind.
The 2014 version of the OECD Employment Outlook report cited by Morgan
Stanley defines low-paying jobs as those for which earnings are below
two-thirds of a country�s median income.
According to the OECD analysis and the Morgan Stanley report, just over
a quarter of jobs in the US fell in this low-paying category.
In 2013, the median annual income in the US was $35,080, according to
the Bureau of Labor Statistics� Occupational Employment Statistics
program.
Under the OECD�s definition, then, a low-paying job would earn less than
about $23,390.
In Ireland, the CSO estimates the average wage to be around �688 a week,
or �35,620 a year. This means that anyone earning under �23,641 is
classed as low-paid by the OECD.
�Ireland remains the most Foreign
Direct Investment (FDI) intensive economy in Europe and IDA has
continued to play its part in winning the highest quality investments."
"In general, the share of employment
associated with extra-EU exports tends to be the highest in smaller
countries, notably Malta, Ireland (12.2 per cent in 2007), Finland (11.6
per cent) and Luxembourg (11.3 per cent).
Among the bigger economies, it is in
Germany that the extra-EU exports made the largest contribution to
employment (9.6 per cent in 2007), followed by the UK (8.1 per cent) and
Italy (7.7 per cent). In contrast, in Spain this ratio was notoriously
lower at 4.1 per cent.
It is in Germany (3.8 million), UK (2.4
million), Italy (1.9 million) and France (1.8 million) that the largest
number of jobs depending on extra-EU trade can be found in 2007."
"In the year to October 2013 the
number of persons aged 25 and over on the Live Register decreased by
16,324 (-4.7%), and the number of persons aged under 25 decreased by
7,336 (-10.5%).
Annual decreases in persons aged under 25
have occurred in all months since July 2010, while the number of persons
aged 25 and over have fallen annually in all months since July 2012.
The percentage of persons aged under 25
on the Live Register now stands at 15.8% for October 2013, down from
16.6% in October 2012 and 18.1% in October 2011."
"On a seasonally adjusted basis the Live
Register total recorded a monthly decrease of 3,700 in October 2013,
reducing the seasonally adjusted total to 409,900.
In unadjusted terms there were 396,512 people signing on the Live
Register in October 2013. This represents an annual decrease of 23,660
(-5.6%).
This is the first month since May 2009 that the unadjusted Live
Register total has been below 400,000."
"Irish exports of goods trade for
the year 2008 were �86,218m, 3% down on 2007. Excluding a substantial
decline in computers, exports held steady. Computer equipment decreased
from �12,577m to �9,322m (-26%), reflecting the wind-down of Dell's
Limerick operation and Organic chemicals from �19,641m to �17,853m
(-9%).
Chemicals increased from �2,664m to �3,483m (+31%), Pharmaceuticals from
�14,749m to �16,704m (+13%) and Professional, scientific and controlling
apparatus from �2,109m to �2,779m (+32%).
Goods to Great Britain decreased from �15,002m to �14,302m (-5%) and to
Switzerland from �3,251m to �2,555m (-21%). Goods to the United States
increased from �15,825m to �16,657m (+5%), to China from �1,989m to
�2,323m (+17%), to Malaysia from �694m to �1,062m (+53%) and to Spain
from �3,281m to �3,587m (+9%).
Irish merchandise exports are dominated by US-owned firms.
Imports for 2008 were �56,964m, down 10% on 2007.
Computer equipment decreased from �9,277m to �6,754m (-27%). Other
transport equipment (including aviation equipment) decreased from
�2,605m to �2,169m (-17%) and Road vehicles from �4,575m to �3,183m
(-30%).
Pharmaceuticals increased from �2,397m to �2,866m (+20%), Petroleum and
related materials from �4,479m to �4,813m (+7%) and Natural gas from
�1,039m to �1,378m (+33%).
Goods from China and Hong Kong decreased from �5,169m to �4,224m (-18%),
Japan from �1,631m to �1,137m (-30%), Germany from �5,591m to �4,623m
(-17%) and Great Britain from �19,508m to �17,882m (-8%). undefined
undefined
Goods from Denmark increased from �667m to �1,031m (+55%) and Poland
from �268m to �456m (+70%).
In December 2008 the value of exports was �6,772m, up �608m (+10%) on
December 2007, while imports were �4,135m, down �959m (-19%).
The seasonally adjusted value of exports in December 2008 was �6,789m,
4% down on November 2008, while imports were �3,868m, down 11%."
"Irish Economy 2013: Preliminary
figures for February 2013 indicate a seasonally adjusted increase in
exports of �154m (or 2.2%) to �7.00bn from January 2013, according to
the CSO. Seasonally adjusted imports decreased by �69m (or -2%) to
�3.88bn resulting in an 8% increase in the seasonally adjusted trade
surplus to �3.13bn. Comparing February 2013 with February 2012, the
value of exports fell by �753m (or -10%) to �6.65bn. The main drivers being falls in the exports of medical and
pharmaceutical products of �309m (or -15%) and �286m (or -18%) for
organic chemicals.
On an overall basis the EU accounted for �3,845m (or 58%) of total
exports in February 2013. The USA was the main non-EU destination
accounting for 22% (�1,492m) of total exports in February 2013.
Comparing February 2013 with February 2012, the value of imports
decreased by �61m (or -2%) to �3,891m. Imports of petroleum, petroleum
products and related materials decreased by �128m (or -21%). Two-thirds of the value of imports in February 2013 came from the EU,
with one-third coming from Great Britain. The USA (9%) and China (6%)
were the main non-EU sources of imports."
'Value of Irish exports rose to �92bn in
2012 - CSO'
"The value of exports was �92 billion in
2012, a 1% increase on figures from the previous year according to the
Central Statistics Office.
Imports were up 1.5% to �49 billion, resulting in a trade surplus of
�42.98 billion � up 0.2% on 2011.
The United States accounted for 20% of Irish exports during 2012, while
Belgium and Britain both accounted for 15%.
8% of exports last year were to Germany.
Meanwhile, Britain was the source of 31% of Ireland�s imports during
2012. The US accounted for 13%, 7% of imports came from Germany while 6%
came from China.
While the overall value of exports increased, medical and pharmaceutical
exports fell by �1.9bn, or 7%, during 2012. The value of similar imports
also fell, decreasing by 6% to �4.1bn.
Most other export categories saw a rise in value, including a �441m
(35%) increase in petroleum exports and a �578m rise in miscellaneous
manufactured articles."
'Value of Oil Imports Statistics for Ireland , Year 2013
- In Detail'
"Value of Oil Imports for Ireland in year 2013 is US$ 6.878 Billions.
Value is equal to the price per unit of quantity of oil imports
multiplied by the number of quantity units.
This makes Ireland No. 49 in world rankings according to Value of Oil
Imports in year 2013. The world's average Value of Oil Imports value is
US$ 14.94 Billions; Ireland is US$ 8.06 less than the average.
In the previous year, 2012, Value of Oil Imports for Ireland was US$
6.96 Billions Value of Oil Imports for Ireland in 2013 was or will be
1.12% less than it was or will be in 2012.
In the following or forecasted year, 2014, Value of Oil Imports for
Ireland was or will be US$6.67 Billions, which is 3.00% less than the
2013 figure."
"Ireland is the champion of exports in
the Euro Zone. Germany takes a good second place and Portugal's economy
is also quite dependent on the international trade.
Greece on the other hand has the lowest
exports as a percentage of GDP, of the selected countries."
There is a slow decline in the overall
number of mortgages with an increase of mortgages on Standard Variable
Rates and decrease of mortgages on Tracker [ECB] Rates.
"Since peaking at �149 billion at the start of 2009 the amount of
mortgage debt issued by banks in Ireland to Irish households has fallen
to �126 billion. [...]
All told there probably has been a nominal
reduction of around �17 billion in the total amount of mortgage debt
owed by Irish households in the past four years.
Separate data from the Irish Banking
Federation show that �8 billion of new mortgage debt has been issued to
first-time buyers and mortgage top-ups.
It also likely that some elements of the
loans to mover-purchasers, re-mortgagers and BTL borrowers would lead to
more new debt.
Given the �17 billion reduction in the
nominal amount owing and the �8 billion increase from new debt then
something around �25 billion of the mortgage debt that existed at the
peak Q1 2009 has been repaid.
This is a repayment rate of around �1.5
billion per quarter."
'Cold comfort: Iceland
writes �24,000 off every mortgage'
Tuesday,
December 03, 2013
"Hard-pressed Irish
homeowners will find cold comfort in the news that Iceland
is to write off �24,000 from every household�s mortgage.
Voters here are used to
pre-election party pledges evaporating into the fog of
fantasy but, in the land of frost and fire, politicians have
proven they can be true to their word.
In April�s elections, prime minister Sigmundur David
Gunnlaugsson said he would introduce sweeping measures to
ease the burden of household debt.
And now he has put the country�s krona where his mouth is.
The writeoff of �24,000 per mortgage will reduce household
debt by 13% according to the government�s website.
According to RT.com, the government said the debt relief
will begin by mid-2014. According to estimates, the measure
will cost almost �900m.
That may seem like a slush-fund compared with the oceans of
debt faced by many European nations, but bear in mind
Iceland�s population is just over 320,000.
The population has been weighed down by debt since the
financial crisis five years ago. The krona�s collapse drove
borrowing costs much higher.
�Currently, household debt is equivalent to 108% of GDP,
which is high by international comparison,� the government
said in a statement.
�The action will boost household disposable income and
encourage savings,� it said.
According to AFP, the debt relief promise has been met with
scepticism, with the IMF, and the Organisation for Economic
Co-operation and Development warning against it.
The IMF had previously said Iceland has �little fiscal space
for additional household debt relief�, while the OECD had
called for the mortgage relief efforts to target only
low-income households."
'Residential Mortgage Arrears and
Repossessions Statistics: Q3 2013'
Central Bank of Ireland
"The number of mortgage accounts for
principal dwelling houses (PDH) in arrears, fell from 142,892 (18.5 per
cent of the total stock ) to 141,520 (18.4 per cent) during the quarter
to end-September 2013.
The outstanding balance on all PDH mortgages in arrears fell by 0.5 per
cent during Q3, the first decrease since the series began in September
2009. However, this decrease masks divergent trends between short-term
and longer-term arrears.
PDH mortgage accounts in arrears of over 90 days at end-September 2013
amounted to 99,189, an increase of 1,315 on the previous quarter. This
increase was driven entirely by accounts in arrears over 720 days with
all other maturity categories declining.
The number of PDH accounts in early arrears of less than 90 days
declined by 6 per cent during the third quarter, compared to a decrease
of 3.3 per cent in Q2.
There was a total stock of 80,555 PDH mortgage accounts classified as
restructured at end-September, reflecting a quarter-on-quarter increase
of 1.5 per cent. Of these restructured accounts, 78.9 per cent were
deemed to be meeting the terms of their current restructure arrangement.
The number of buy-to-let (BTL) mortgage accounts in arrears rose from
39,948 (26.9 per cent) to 40,426 (27.4 per cent) in the third quarter of
2013. However, similar to PDH developments, the increase was driven by
longer-term arrears, with the number of accounts in arrears up to 180
days declining.
There were 31,227 (21.2 per cent) residential mortgage accounts for BTL
properties in arrears of over 90 days at end-September 2013, up from
30,326 (20.4 per cent) at end-June 2013.
A total of 23,776 new restructure arrangements were agreed during the
third quarter of the year. The share of interest only arrangements and
reduced payment
arrangements (interest plus some capital) fell further during Q3, to
41.4 per cent from 49.7 per cent at end Q2 indicating a move out of
short-term arrangements. Arrears capitalisations and term extension
arrangements increased during the third quarter of
the year, and accounted for 20 per cent and 19.2 per cent of total
restructures at end
-Q3, respectively.
Legal Proceedings and Repossessions
During the third quarter of 2013, legal proceedings were issued to
enforce the debt/security on a PDH mortgage in 1,830 cases. Court
proceedings concluded in 361 cases during the quarter, and in 89 of
these cases the Courts granted an order for repossession or sale of the
property. There were 1,002 properties in the banks� possession at the
beginning of the quarter. A total of 209 properties were taken into
possession by lenders during the quarter, of which 76 were repossessed
on foot of a
Court Order, while the remaining 133 were voluntarily surrendered or
abandoned.
During the quarter 158 properties were disposed of. As a result, lenders
were in possession of 1,050 PDH properties at end-September 2013."
"Irish household debt is also very cheap.
About one-third of household debt is in incredibly cheap tracker-rate
mortgages. The repayments on these are now far lower than when these
loans were taken out between 2005 and 2008. In that time the ECB rate
has gone from 4.25pc to 1.00%. The average interest rate on these loans
is around 2pc.
Rather than using
incorrect figures I would put the level of debt in the Irish
economy at the end of 2011 as roughly the following:
Household Debt: �186 billion
Government Debt: �167 billion
Business Debt: �145 billion
This is almost �500 billion and is four times Ireland�s
Gross National Product. This is an excessive level of debt."
[25 January 2012]
Let us look at "the myths of
our allegedly massively high savings rates. All of the data [above] is
taken from the IMF WEO database.
Let us rank Ireland's gross savings rate compared to all other advanced
economies (higher rank means lower savings rate): [table above]
Contrary to what our Taoiseach and Mr
Coveney were saying, Ireland's savings rate in 2010-2014 is estimated by
the IMF to be... the 5th lowest in the sample of 33 advanced economies
around the world. May be it is the highest in the Euro zone? Oh, no - it
is actually the fourth lowest in the Euro zone."
'We spend �11bn less a year than in boom but pay �2bn more tax'
Irish Independent
Aideen Sheehan
Consumer Correspondent
23 August 2013
"IRISH people are spending �11bn
less a year than they did at the height of the boom, but are paying �2bn
more in tax.
That is a decrease of around �2,500 for every man, woman and child in
the country compared with what we spent five years ago.
We are spending far less on food, drink, cigarettes and clothes than we
did in 2007 and 2008, new Central Statistics Office figures have
revealed.
Yet we are handing over �2bn more in taxes than a couple of years ago
� around �500 more for every person.
While personal spending peaked at �94bn in 2008, it fell back
dramatically to �82.6bn last year, the CSO's National Income and
Expenditure 2012 report shows.
Sellers of household equipment took the biggest hit of all as consumers
spent only �1.8bn � less than half the 2007 figure.
Cars and other transport equipment saw a similar drop in spending to
just �2.1bn, but the cost of filling-up and running a vehicle has soared
by more than �1bn in only three years to �5.5bn.
We are also spending �1bn a year less on clothing and footwear, with
spending on fashion down from �4bn in 2007 to �2.9bn last year.
Households paid �23bn in taxes on income and wealth last year compared
with �21bn in 2010.
While we paid slightly more in tax at the peak of the boom, that was at
a time when hundreds of thousands more people were working.
Hard-pressed families have also taken a �900m hit in child benefit since
2008, with payments down from �2.9bn in 2008 to �2bn last year.
The amount paid out in unemployment assistance has trebled to more than
�3bn during the recession because of growing dole queues.
However, some payments fell steeply, such as disability benefit and
domiciliary care payments for children.
The Government also spent �1bn more on old age contributory pensions
last year than it did during the boom, with payments rising from �2.8bn
to �3.8bn.
AUSTERITY
Despite austerity, consumer spending has increased very slightly since
its low point in 2010.
In particular, we spent �100m more a year on alcohol than we did two
years ago, forking out �6.36bn last year in pubs, off-licences and
supermarkets.
Spending on food has also climbed, by about 5pc or �61m since 2010,
rising to �7.4bn last year.
The amount we spent on home energy and electricity has also soared, by
�350m since 2007 to �3.4bn in 2012 as customers have faced a series of
price hikes.
And housing costs � which includes rent and home ownership � are also on
the up, rising by nearly 3pc last year to �15.1bn."
'Facts and
Statistics About the Irish Community and Voluntary Sector'
"More than half of the organisations in existence today have
been formed since 1986...
Governance and Company Profile
1. 59,600 directors serve on the boards of Irish nonprofit
companies. Board membership in the sector is almost
invariably unpaid.
2. If an average of eight trustees (for the 3,700
unincorporated charities in the database) is added, this
means that up to 90,000 people serve in a voluntary capacity
in the governance of the nonprofit sector in Ireland.
3. Of the nonprofit companies currently trading, 70 were
incorporated prior to 1950; 3,571 were incorporated between
1950 and 1999; 4,934 were incorporated between 2000 and the
first quarter of 2010. Of the recently-�established
nonprofit companies, many are local development
organisations � enterprise, partnership and community
development companies and many others set up with government
funds to deliver local supports.
The Financial Profile of the Sector
4. The total reported income of the nonprofit companies in
the Irish Nonprofits Database (upon which these statistics
are based) in 2009 was �5.75bn.
5. Reported assets held by the nonprofit companies amounted
in 2009 to �3.4bn, of which cash totaled �1.7bn.
6. 951 companies reported a negative asset position,
collectively totalling �152m in net liabilities.
7. There is no consistency in the presentation of incoming
resources. About half of the nonprofit companies featured in
the Irishnonprofits database (upon which this data is based)
provide an analysis of the sources of their income, whether
from grants, donations, or trading activities, whereas the
rest simply report �income�. This situation will change in
2010 for reasons discussed already. In the meantime, all of
the amounts below are certainly an understatement of the
true position. Of those nonprofit companies that report the
sources of their income:
42 report receiving legacies and bequests to a net value of
�7.3m, in amounts varying from �795 to �1,254,466 -� a mean
average of �172,951
24 report receiving donations in kind (i.e. non-�cash) to a
net value of �100m � a mean average of �4,182,868
733 report �donations� in values ranging from �10 to
�6,916,903, with total reported donations in 2009 valued at
�77m.
Grants & Funding
8. Grants, whether from State or private philanthropic
sources, are by far the single largest source of income.
Grants are reported as a source of income by 2,886 nonprofit
companies at a combined level of �2bn, with:
443 organisations reporting total grant income of less than
�10,000,
555 reporting grant income of between �10,000 and �50,000,
1,441 reporting grant income between �51,000 and �.5m, and
433 reporting grant income in excess of �.5m.
9. Ten nonprofits (only one of which is not a health service
provider) with a combined turnover of just over �1bn account
for �.9bn of reported grant income.
10. The total number of grant sources itemised in the Irish
Nonprofits Database is 672, with Irish government
departments and agencies accounting for the great majority
of these, and a small number of Irish-�based international
NGOs reporting grants from a variety of foreig governments
and international agencies. The profile of grants by source
is as follows:
1,778 nonprofits report a grant from one source only
518 report grants from two sources
280 report grants from three sources
154 report grants from 4 sources
245 report grants from between 5 and 10 sources
20 report grants from between 11 and 19 sources.
Payroll and Employment
11. Of the 3,857 nonprofit companies that report employee
numbers and/or payroll costs, the total number of employees
in 2009 was 101,054.
12. Hospitals and healthcare providers are the largest
employers, with 26 institutions alone responsible for the
employment of 4,200 of these.
13. The profile of employment numbers suggests a sector of
SMEs:
1,458 nonprofit companies employ 5 people or fewer.
1,606 employ between 6 and 50 people.
90 employ between 51 and 99 people
Just over 100 nonprofits employ more than 100 people.
14. The accounts of about 3,500 nonprofit companies report
neither staff numbers nor payroll costs, thus indicating
that they operate on an entirely voluntary basis.
15. No data are yet publicly available about employment
levels in the 3,700 unincorporated charities which enjoy
tax-�exempt status from Revenue (this will presumably change
when the provisions of the Charities Act 2009 are
commenced).
16. The total wages and salaries expenditure in Irish
nonprofit companies in 2009 was �3.7bn, with a further �290m
remitted in employers� PRSI. FAS contributed �151m, in
reported grants to 477 nonprofit companies. The geographic
profile of the sector.
17. The registered address of a nonprofit body does not
indicate the reach of its activities � many national
organisations for example are headquartered in Dublin.
However, the map above is indicative of the geographic
distribution of all 11,700 nonprofits in the Irish
Nonprofits Database."
'Ireland ranked the most generous country in Europe for
third year running'
'70 per cent of Irish people give money to good causes'
By James Martin on December 3, 2013 The Irish Post
"IRELAND has been named the most generous country in Europe and the
fifth most generous country in the world.
It marks the third year in-a-row that the country has topped its
European neighbours in the World Giving Index survey.
In the world rankings Ireland dropped from its previous position as the
second most generous nation on the planet.
The global survey measured three categories: direct donations to
charity, volunteering personal time and a willingness to help strangers.
70 per cent of Irish people were found to donate money to charity, 37
per cent give up their time for good causes and 64 per cent of people
help strangers in a typical month, according to the according to the
World Giving Index.
This year, Volunteer Ireland found there was an increase in the number
of people volunteering in Ireland, up three per cent to 37.
The World Giving Index is based on surveys in 135 countries over the
past year.
Yvonne McKenna, CEO of Volunteer Ireland, said: �The research highlights
the remarkable generosity of spirit that continues to thrive in Ireland
throughout difficult times.
�Connecting with people is something that is inherent to our culture in
Ireland and this is reflected in the statistics.�
McKenna named The Gathering and the tenth anniversary of Ireland�s
hosting of the Special Olympics World Games as two events which
contributed to 2013 being a milestone year for volunteering in Ireland.
�These remain difficult times and we are still in the midst of a social
and economic crisis, yet the growth of interest in volunteering is a
positive side of the country�s downturn,� she added."
'Poor regulation in �5bn charity
sector, report finds'
By Evelyn Ring
Irish Examiner Reporter
Wednesday, March 13, 2013
"Ireland�s �5bn not-for-profit sector
must be regulated, a report has urged.
The Fundraising Performance report by fundraising specialists 2into3 and
sponsored by specialist charity insurer Ecclesiastical shows that
organisations employ more than 100,000 people, with salaries
representing 46% of spending.
The report, based on an analysis of accounts from 1,000 charities, shows
funds continue to rise despite the recession, with about �4.9bn raised
in 2011.
Director of 2into3, Neil Pope, said the sector was poorly regulated.
In particular, variations were found in the amount of information
available about how funds were raised and for what purpose.
Mr Pope said Justice Minister Alan Shatter should enforce the 2009
Charities Act that would support the growth of the sector and provide a
better infrastructure to manage both fundraising and spending.
�No other sector of such scale operates without governance and
regulations.�
�Given the sensitivity of the projects and importance of fundraising to
so many sectors it is vital that the Government acts now to bring
further peace of mind to donors and recipients alike by enforcing the
legislation,� he said.
While the �4.9bn was up 3.7% on the previous year, the scale of
organisations in the sector and their success varied. Just under 40% of
organisations had an income of less than �100,000 and almost 80% had an
income of less than �500,000. Just one in eight (12.5%) had an income in
excess of �1m."
Securities are a form of ownership that can
be easily traded on a secondary market. Securities allow you to own the
underlying asset without taking possession.
For this reason, securities are very easily
traded, or very liquid. They are easy to price, and so are a great
indication of the underlying value of the asset.
Traders must be licensed to buy and sell
securities to assure they are trained to follow the laws set by the
Securities and Exchange Commission (SEC).
The invention of securities helped the
create the huge success of the financial markets.
There Are Three Types of Securities:
1. Equity Securities - These allow you to own shares of a
corporation. The most direct way is to buy stocks of a company yourself.
You can also profit by buying shares of a mutual fund, which invests in
the stocks for you. The secondary market for equity derivatives is the
stock market, such as the New York Stock Exchange and the NASDAQ.
You can also buy stocks of a new company before it hits the stock
exchange. The shares of this Initial Public Offering (IPO) are bought
from investment banks, like Goldman Sachs or Morgan Stanley. However,
you usually have to have a lot of money, because these shares are sold
in bulk quantities. Once they hit the stock market, their price usually
goes up. However, you can't cash in for a certain period of time. By
then, the stock price might have gone down below the initial price.
2. Debt Securities - These allow you to provide loans, called
bonds, to a company or even a country. Ratings companies, like Standard
& Poor's, Moody's and Fitch's evaluate how likely it is the bond will be
repaid. To insure a successful bond sale, borrowers must pay higher
interest rates if their rating is below AAA. If the ratings are very
low, they are known as junk bonds. Despite their risk, investors buy
junk bonds because they offer a higher interest rate.
Corporate bonds are loans to a company. If the bonds are to a
country, they are known as sovereign debt.. Bonds issued by the U.S.
government are Treasury bonds. Because these are the safest
bonds, Treasury yields set a benchmark for all other interest rates. In
April 2011, when Standard & Poor's cut its outlook on the U.S. debt, the
Dow dropped 200 points. That's how significant Treasury bond rates are
to the U.S. economy.
3. Derivative Securities - Traders are always trying to find ways
to get a higher return with less risk. Therefore, innovative derivatives
of basic stocks and bonds are often developed. Stock options allow you
to trade in stocks without actually buying them upfront. For a small
fee, you can buy a call option to purchase the stock at a certain date
at a certain price. If the stock price goes up, you exercise your option
and purchase the stock at your lower negotiated price, then immediately
resell it for the higher actual price.
A put option gives you the right to sell the stock at an agreed
upon price. If the stock price is actually lower that day, you buy it
and make a profit by selling it at the agreed upon, higher price.
Futures contracts are derivatives based on commodities, such as
oil, pork bellies, or even currencies. Like options, you pay a small fee
(called a margin) to get the right to buy or sell the commodities for an
agreed-upon price in the future. However, futures are more dangerous
because, rather than buying options that you can choose to ignore, you
are entering into an actual contract that you must fulfill.
Asset-backed securities are derivatives whose values are based on
the returns from bundles of underlying assets, usually bonds. The most
familiar are mortgage-backed securities, which helped create the
subprime mortgage crisis. Others include asset-backed commercial paper,
which are corporate loan bundles backed by assets such as commercial
real estate or autos. Collateralized debt obligations (CDOs) take these
securities and divide them into tranches, or slices, with similar risk.
Auction-rate securities were derivatives whose values were
determined by weekly auctions of corporate bonds. Investors thought the
returns were as safe as the underlying bonds. However, the securities'
returns were actually set according to weekly or monthly auctions run by
broker-dealers. Since this was a more shallow market, the securities
were actually more risky than the bonds themselves. In fact, this market
froze in 2008, leaving many investors holding the bag, leading to SEC
investigations.
The
secondary mortgage market (or secondary market) allows banks to sell
mortgages, giving them new funds to offer more mortgages to new
borrowers. If banks had to keep these mortgages the full 15 or 30 years,
they would soon use up all their funds, and potential homebuyers would
have a more difficult time to find mortgage lenders.
Many of the mortgages on the secondary market are bought by Fannie Mae.
Other are packaged into mortgage-backed securities, and sold to
investors.
For example, Fannie Mae buys mortgages from banks, a process known as
buying on the secondary mortgage market.
The Federal National Mortgage Association (FNMA), colloquially known as
Fannie Mae, was established in 1938 by amendments to the National
Housing Act after the Great Depression as part of Franklin Delano
Roosevelt's New Deal.
Fannie Mae was established to provide local banks with federal money to
finance home mortgages in an attempt to raise levels of home ownership
and the availability of affordable housing.
Fannie Mae created a liquid secondary mortgage market and thereby made
it possible for banks and other loan originators to issue more housing
loans, primarily by buying Federal Housing Administration (FHA) insured
mortgages.
"Investment in foreign securities rises to
�1.59 trillion at end-2012.
The value of Irish residents� holdings of
foreign securities at end-December 2012 amounted to �1,589bn, up �157bn
on the revised 2011 level of �1,432bn.
The increase is largely accounted
for by increases in equity and in bonds and notes assets."
Homelessness in Ireland
Peter Mc Verry Trust "Peter McVerry Trust is committed to
reducing homelessness, the harm caused by drug
misuse and social disadvantage through the principle of a housing first
model. Peter
McVerry Trust provides low-threshold entry services, primarily to
younger persons with
complex needs, which offer pathways out of homelessness within a
framework of equal
opportunities, dignity, and respect."
'Frightening increase' in
homelessness - Simon Community
Tuesday, 24 September 2013 "The Dublin Simon Community has
reported what it describes as a frightening increase in homelessness in
recent months. Its rough sleeper counts in Dublin city centre have shown
an 88% increase on last year.
The charity, which launched its annual review today, said the figures
recorded by its teams since July are the highest ever. The most recent
figures for September show the numbers have nearly tripled compared to
the same period last year.
On one night this month it found 85 people sleeping rough in the core
city centre area between Jervis Street and Harcourt Street. Spokesperson
Sam McGuinness said the Government's plan to end homelessness by 2016 is
in real jeopardy.
The charity fears further cuts in next month's Budget will make its work
extremely challenging. It said the reasons for the increase are shortage
of housing and emergency accommodation, increased rents and rent
allowance restrictions."
http://www.rte.ie/news/2013/0924/476048-homeless-simon-community/
"Brazil has 1.8 million homeless people.
Ireland has 5,000 homeless people, with
a GDP per capita nine times that of Brazil.
Brazil, perhaps, has some excuse for the
continuing existence of homelessness.
The failure of Government to
increase the stock of social housing to meet
demand, even during the Celtic Tiger years,
resulted in an increase in the number of
homeless people from 2,500 in 1996 to over
5,000 today and rising, while the number
of households waiting for social housing
has increased from 25,000 in 1996 to over 100,000 today and rising."
http://static.rasset.ie/documents/news/peter-mcverry-annual-report.pdf
"The Dublin Region Homeless Consultative Forum
and Management Group
notes that there were a
minimum of
94
persons confirmed to be sleeping rough on the night of the most recent count held in
April 2013.
This
spring
count found people identified as sleeping rough were:
Male (72)
Female (11)
Unknown (11).
'Proportion of public expenditure on
education fell by 40% in a decade'
Pamela Duncan
Wed, Jun 26, 2013
"OECD report finds educational attainment
levels in Ireland have increased significantly since 2000.
The proportion of public expenditure on education fell by
more than 40 per cent in the decade between 2000 and 2010,
according to statistics published by the Organisation for
Economic Co-operation and Development.
The proportion of public expenditure on education fell fell
from 13.7 per cent to 9.7 per cent in the decade between
2000 and 2010 according to statistics published by the
Organisation for Economic Co-operation and Development
(OECD).
The OECD Education at a Glance 2013 report shows that the
proportion of public expenditure on education in Ireland
stood at 13.7 per cent in 2000, above the OECD average of
12.6 per cent.
However, a decade later Ireland�s education spend accounted
for 9.7 per cent of public expenditure, below the OECD
average of 13 per cent.
The drop in the proportion of public expenditure which goes
towards education saw Ireland fall to 29th place in a 2010
ranking of 32 OECD countries, above only the Czech Republic,
Japan and Italy.
Reacting to the report Peter Mullan of the Irish National
Teachers� Organisation (INTO) said the fall in the
proportion of public spending on education was directly
responsible for cuts to school budgets, school staffing and
special needs teaching hours.
�It�s time we had a national debate on funding education
properly in Ireland to ensure that all children get the
education they deserve,� he said.
ASTI General Secretary Pat King described the reduction in
available public expenditure for education as �alarming�.
�This failure to prioritise and protect young people�s
education can only be described as reckless and flies in the
face of the Government�s stated commitment of developing
Ireland as a knowledge economy,� he said.
However, despite the drop in the share of money being spent
on education, the OECD reported that expenditure per student
actually rose by 33 per cent Ireland between 2005 and 2010.
At the same time as the number of students at primary and
secondary level and those taking part in post-secondary
courses which do not result in a university degree or
equivalent qualification rose by by 8 per cent.
It found that the total cumulative expenditure per student
by educational institutions over the duration of their
primary and secondary studies added up to USD $129,662 in
2010, above the OECD average of USD $106,320.
Educational attainment levels
The report found that educational attainment levels have
increased significantly in Ireland since 2000, something it
said was largely due to the younger generations:
�38 per cent of 25 to 34 year-olds have an upper secondary
education as the highest level of attainment and 47 per cent
have tertiary qualifications [see table above]. This
represents not only an important cross-generational change
compared with older adults...but places Ireland above the
OECD average of 39 per cent...For this age group, Ireland is
now ranked behind only Canada, Japan and Korea.�
The OECD report showed that 89 per cent of Irish young
people were expected to complete their Leaving Certificate
in their lifetime meaning Ireland ranks 11th of 27 countries
for second-level school completion and above the OECD
average of 83 per cent.
Ireland also performs above average in terms of the
percentage of students progressing from second-level to
third level.
Neither employed nor in education or training
However, the OECD warned that, on average, young people in
Ireland will spend more than three years either unemployed
or out of the labour force.
�A significant proportion of young people are at risk of
finding themselves neither employed nor in education or
training (NEET), hampering their future integration into the
labour market,� the report cautioned, adding that NEET rates
for 15-29 year-olds stood at around 10 per cent in 2007, a
figure which had more than doubled to 22 per cent in 2011."
'Irish health spending contracting faster than any other country
except Greece'
Paul Cullen Jul 2, 2013
"Irish health spending is contracting
at a faster rate than any other country except Greece, having grown at
record levels during the boom, new figures show.
Spending on the health system fell by over 5 per cent a year in
2009-2011, driven by Government efforts to reduce the large budgetary
deficit, according to OECD Health Data 2013. In contrast, it grew by
almost 9 per cent annually during the period 2000-2009. Total health
spending, at 8.9 per cent of gross domestic product, is slightly under
the OECD average, but spending per head of population remains above
average. Ireland spends more on each citizen�s health than the UK,
Iceland, Japan and New Zealand.
Private sources While the public sector continues to be the main source of health
funding, one-third of funding now comes from private sources as a result
of increased charges levied on patients for drugs and appliances.
The OECD figures show Ireland has fewer doctors than most European
countries, though more per head of population than in the US or Canada.
Ireland has a relatively high number of nurses, though the report warns
about comparing data as nurses and midwives can be categorised
differently.
Life expectancy in Ireland is a half-year above the OECD average, but up
to two years behind Switzerland, Japan and Italy. With 29 per cent of
the population smoking, Ireland is well above the average 21 per cent.
Alcohol consumption, while it has declined, is also among the highest in
OECD countries, at 9.4 litres per person per year."
Total health spending accounted
for 8.9% of GDP in Ireland in 2011, slightly less than the OECD average
of 9.3%.The recent recession initially led to a big rise in the health
spending share of GDP in Ireland,from 7.9% in 2007up to 10% in 2010, as
GDP fell sharply between 2008 and 2010 while health spending continued
to grow. But starting from 2010, a sharp reduction in health spending
led to a decrease in the health spending share of GDP.
Despite the cuts in 2010 and 2011, health spending per capita in Ireland
remained above the OECD average, with spending of 3700USD in
2011(adjusted for purchasing power parity)compared with an OECD average
of 3339USD.
"As you can
see from the chart above, in 2010, Ireland ranked somewhat
average in our public expenditure on pensions, with the
inclusion of all government pension costs; contributory,
social welfare pensions, non-contributory pensions and
public sector pensions.
If you look at the next chart, you can see that the
projected change in expenditure is quite significant between
2010 and 2060, Ireland projected to rank third on the table.
The charts highlight the rising cost of State funded
pensions which the National Pensions Reserve Fund (NPRF) was
intended to offset.
Broadly speaking 1/3rd of the NPRF covered public sector
pensions whilst 2/3rds covered social welfare pensions.
The fastest increasing cost is public sector pensions. These
grew from an estimated capital cost of �75bn in 2007 to
�129bn in 2009. No figures have been produced since, however
it is likely that that cost has continued growing.
Source: OECD Review of Pensions in Ireland, 14.09.2012. John
Martin, Edward Whitehouse, Anna D'Addio, Andrew Reilly."
'ESB staff anger over �400m
pension move'
Barry O'Halloran Fri, Jun 28, 2013
"Trustees chairman warns payment to Government puts scheme
under severe financial strain. ESB staff are threatening
legal action to halt the payment on the basis that it could
undermine the security of their pension scheme, which has an
estimated �1.7 billion deficit.
The chairman of the ESB�s pension plan trustees has warned
the group�s chief executive, Pat O�Doherty, against plans to
hand over �400 million to the Government while its
retirement scheme is �under severe financial strain�.
The State-owned energy company has agreed to pay a �400
million special dividend to the Exchequer pending the sale
of some of its power plants, but staff are threatening legal
action to halt the payment on the basis that it could
undermine the security of their pension scheme, which has an
estimated �1.7 billion deficit.
While the row only boiled over in public this week, it
emerged that the chairman of the scheme�s trustees, Tony
Donnelly, wrote to ESB chief executive, Pat O�Doherty in
April warning of the proposal�s likely impact on the
workers� pension pot.
Electricity customers in the Republic pay a public service
obligation levy designed to pay for Government-approved
supports given to green-energy projects, peat-fired
generating plants, Tynagh Energy and Aughinish Alumina (above).Electricity
cost to rise by �205m due to levy increase
Minimum
Mr Donnelly, a former financial director of ESB, confirms in
his letter that the scheme�s actuaries reported that,
according to the minimum funding standard laid down in the
Pensions Act, it had a �1.7 billion deficit at the end of
2011.
�Given the large deficit in the scheme [under the State�s
own minimum funding standard regulations], it is difficult
for the trustees to comprehend the company�s paying a large
special dividend to the State which is likely to have an
adverse affect on the financial health of the company and
consequently the financial security of all members of the
scheme,� Mr Donnelly says.
He concludes that �the trustees would ask the company to
reconsider the proposals to pay a special dividend to the
State and ensure that the Government are aware of the
significant regulatory deficit and risks to this fund and
the company�.
Shortfalls
Mr Donnelly points out that the High Court last year refused
to sanction Aer Lingus�s proposed �500 million payout to
shareholders in light of shortfalls totalling almost �900
million in the airline�s employees� schemes. He warns that
the ESB plan could be regarded as a �contingent creditor� of
the company in circumstances where it is underfunded.
Four staff have already threatened to take legal action to
halt the payment of both the �78 million yearly dividend
from the company to the Exchequer, which it approved at this
week�s annual general meeting, and the �400 million special
dividend.
Along with this, the general secretary of the company�s
group of unions, Brendan Ogle, has warned that workers will
take all necessary �legal, political and industrial� action
to protect their pension scheme�s assets.
The group�s finance director, Donal Flynn, said yesterday
that the company has submitted a plan designed to meet the
funding standard to the Pensions Board eight months ago.
�The regulator has accepted that plan,� he added.
Mr Flynn also repeated the company�s argument that the
minimum funding standard, which calculates a scheme�s
liabilities in the event of it being wound up, is �not
appropriate� in the ESB�s case.
He pointed out that the 1942 legislation which first
established the scheme does not envisage it being wound up,
and for that reason, a different standard should apply.
The fund�s actuaries confirmed at the end of last year that
it was in a position to meet its liabilities as they fell
due and that a plan put in place in 2010 to cover a �2
billion deficit was still on track.
One of the key flashpoints between the staff and the company
is its description of the scheme in its annual report as a
defined contribution plan and an assertion that the ESB has
no liability for any future deficit that might arise in the
plan.
Standards
Mr Flynn, yesterday argued that this description is in line
with accounting standards as the scheme has always had
characteristics of both defined contribution and defined
benefit plans. He said that this is also why the Pensions
Board regards it as a defined benefit scheme. �They are both
looking at it through different prisms,� he said.
The ESB changed its definition of the scheme after the 2010
funding plan was agreed."
"All fuels,
with the exception of coal and renewables, experienced
reductions in consumption in 2011. Renewables in aggregate
increased by 23% to 831 ktoe and coal use increased by 1.9%
to 1,264 ktoe.
Fossil fuels accounted for 94% of all energy used in Ireland
in 2011, excluding the embodied fossil fuel content of
imported electricity. Demand for fossil fuels fell by 7.9%
in 2011 to 12,982 ktoe and has fallen 15% since 2005.
Oil continues to be the dominant energy source, increasing
from a share of 47% in 1990 to a peak of 60% in 1999, but
falling to 49% in 2011. Consumption of oil, in absolute
terms, fell by 7.4% in 2011 to 6,820 ktoe. Over the six
years 2005 � 2011, oil demand fell by 25% (4.27% per annum).
Natural gas use fell in 2011 by 12% to 4,138 ktoe and its
share of TPER was 30%. The increase in 2010 was 9.2%, mainly
due to the severe winter conditions and increased use in
electricity generation. Over the six years 2005 � 2011,
natural gas use has increased by 19% (2.9% per annum).
In absolute terms over the period 1990 � 2011 coal declined
by 39% to 1,264 ktoe. In 2011 the use of coal increased by
1.9%. Increased use in electricity generation accounted for
all of this increase as coal use in final consumption in
both industry and the residential sector fell in 2011. Over
the five years 2005 � 2010, coal demand fell by 34% (8% per
annum).
Peat use fell by 3.8% in 2011 to 761 ktoe and over the
period 1990 � 2011 its use declined by 45% resulting in its
share in primary energy falling from 14% to 5.5%. The
decrease in use of peat in 2011 occurred both in electricity
generation (-2.1%) and the residential sector (-4.8%).
Wind energy experienced a fall in 2010 of 4.8% but grew by
56% in 2011 to 4,380 GWh (377 ktoe), due to a 13% growth in
installed capacity and (3% - 4%) higher than average wind
speeds and particularly low wind speeds in 2010. The share
of wind in overall energy use in 2011 was 2.7%.
The Hydro resource recovered in 2011 to average levels (707
GWh or 61 ktoe) resulting in an 18% increase in hydro
generated electricity relative to 2010.
Total renewable energy increased by 23% during 2011 to 831
ktoe. On average in the period 2005 � 2011, renewable energy
demand increased by 14% per annum. Since 1990 renewable
energy has grown by 395% (7.9% per annum on average) in
absolute terms.
Electricity imports fell by 3.7% in 2011 and accounted for
only 0.5% of primary energy.
"Overall fuel
inputs into electricity generation fell by 8.6% in 2011 to
4,506 ktoe while final consumption of electricity fell by
just 2.2% to 2,140 ktoe (or 24,881 GWh).
The share of overall fossil fuel used in electricity
generation was 88% in 2011. This was a 4.1 percentage point
decrease in share or 12.7% in absolute terms relative to
2010.
Natural gas remains the dominant fuel in electricity
generation but its share fell from 61% in 2010 to 55% in
2011. Natural gas use in electricity generation was 2,500
ktoe in 2011, 17% lower than in 2010.
Fuel oil had a share in electricity generation of 11% in
1990; this rose to 28% in 1999 but in 2011 is minimal at
0.9%. Consumption of fuel oil in electricity generation in
2011 was 40 ktoe.
The share of coal used in electricity generation has reduced
from 40% in 1990 to 20% in 2011. In absolute terms the
consumption of coal has fallen by 27% over the period (1.5%
per annum) to a figure of 913 ktoe. There was an increase in
coal use in 2011 for electricity generation of 5.3%.
Peat consumption in electricity generation fell by 2.1% to
480 ktoe in 2011 and by 21% since 1990.
Renewable energy use for electricity generation increased
its share from 1.9% to 11.5% between 1990 and 2011. In 2011
there was a 40% increase in renewables contribution to the
electricity fuel mix due mainly to the increased
contribution from wind. Wind contribution to electricity
generation increased by 56% in 2011 while the contribution
from hydro increased by 18%. Other renewables in the form of
landfill gas, biogas and biomass make up the remainder of
the contribution at 1.7% of fuel inputs and their use in
electricity generation increased by 5.6% in 2011.
"Domestic
production accounted for 32% of Ireland�s energy
requirements in 1990. However, since the mid-1990s import
dependency has grown significantly, due to the increase in
energy use together with the decline in indigenous natural
gas production at Kinsale since 1995 and decreasing peat
production.
Imported oil and gas accounted for 77% of TPER in 2011,
compared with 50% in the early 1990s. Ireland�s overall
import dependency reached 90% in 2006 but has decreased to
88% in 2011.
This trend reflects the fact that Ireland is not endowed
with significant indigenous fossil fuel resources and has
only in recent years begun to harness significant quantities
of renewable resources."
"Figure 37
shows the indigenous energy fuel mix for Ireland over the
period. The reduction in indigenous supply of natural gas is
clearly evident from the graph as is the switch away from
peat. Production of indigenous gas decreased by 85% over the
period since 1990 to 285 ktoe and peat by 46% to 760 ktoe.
Renewable energy in contrast increased by 343% to 742 ktoe.
Indigenous production peaked in 1995 at 4,105 ktoe and there
has been a 48% reduction since then to 1,801 ktoe.
The share of total indigenous fuels contribution from native
gas was 16% in 2011, compared with 54% in 1990. The share of
peat increased from 41% in 1990 to 42% in 2011 but in
absolute terms peat production declined by 46%.
Renewable energy accounted for 41% of indigenous produced
fuels in 2011.
Although peat production fell in 2011 by 23%, peat
consumption fell by just 3.8%, with significant stock
changes accounting for this difference.
Developments are likely to impact on this trend including
the plans to extract and utilise gas at the Corrib Gas Field
and the targets for increasing the deployment of renewable
energy."
What are the sources of wealth and
taxation for the state?
Ireland�s
economic chickens come home to roost
This article
looks at the failure of successive governments to make full
use of the natural resources of Ireland leading to the
current strategy of heaping more and more new taxation upon
the Irish people to make up for their loss of income
Since the formation of the Irish State in 1922, financial
sources for the maintenance and development of the state as
an independent entity have been in decline. This has arisen
through Ireland�s joining the EEC in 1973 and subsequent
Treaties of the EU, to successive governments� neo-liberal
economic policies that gradually reduced the role and income
of the state. Contributing to these problems was the loss of
fiscal autonomy when Ireland joined the eurozone in 2002.
Sources of income such as customs duties and charges,
fisheries, agriculture, oil and gas, and minerals were all
affected in different ways, leaving the increasing taxation
of the people as the main plank of the government�s policy
to extricate itself from the economic crisis.
Since the banking crisis of 2008, government borrowing [1]
has increased the national debt [2] from � 50.4 billion to �
119.1 billion in 2011, more than doubling it in a few short
years.
Fisheries
The establishment of a customs union (a free trade area with
a common external tariff) was one of the main aims of the
EEC. On joining the EEC in 1973, the Irish government lost
import duties as a source of income from its main trading
partners.
Three years later, in 1976, the EEC extended its fishing
waters from 12 miles to 200 miles under the Common Fisheries
Policy [3] when it was agreed that fishermen from any state
should have access to all waters. Thus, while Ireland owns
23% of the fishing waters [4] in Europe, it is only allowed
3% of the European fish trade quota. [5]
Agriculture
Since joining the EEC there has been ongoing change in Irish
farming [6] but �with fewer and larger farms, less
employment, more specialisation and concentration of
production and growth in part-time farming� yet
�agricultural output remains at about the level of 20 years
ago�. As a source of employment farming has been in decline
for a long time, about 24 per cent in the period from 1980
to 1991 and a further 17 per cent between 1991 and 2000.
Recent demonstrations by farming families in Dublin have
shown the negative effect of government cutbacks, increased
costs and taxes. According to a recent Irish Times [7]
article, �the protest was called to highlight concerns about
planned reforms to the Common Agricultural Policy and the
upcoming budget.
It also highlighted the margins being taken by supermarket
chains at the expense of farmers. Placard messages included
�No Cap cuts; no farm cuts; no extra costs; regulate the
retailers.��
Forestry
More short-sighted policies can be seen in reports [8] that
the State is �also considering selling off some assets of
the forestry body Coillte (The Irish Forestry Board)� to
private investors. Coillte [9] was established under the
Forestry Act 1988, and the company is a private limited
company registered under and subject to the Companies Acts
1963-86.
All of the shares in the company are held by the Minister
for Agriculture, Fisheries and Food and the Minister for
Finance on behalf of the Irish State. Profits have increased
from a loss of �438K (1989) to profits of �4.2 million
(2009).
Moreover, the company [10] employs approx 1,100 people and
owns over 445,000 hectares of land, about 7% of the land
cover of Ireland.
More state assets
In the same article, [11] plans to sell off other state
assets such as parts of Bord G�is (Gas Board) and ESB
(Electricity Supply Board) and �its 25 per cent shareholding
in Aer Lingus� were also being considered.
According to Sinn F�in�s deputy leader and spokesperson for
public expenditure and reform, Mary Lou McDonald, [12] �Both
the ESB and Bord G�is are wealth generating self-financing
companies that have invested heavily in first world energy
infrastructure across the island and created thousands of
good jobs benefiting hundreds of thousands of families over
the decades�.
She added, ��Fine Gael and Labour�s decision to treat the
profitable elements of these companies as a cash cow for
bank debt reduction makes no economic sense and reflects the
kind of short term policy and political decision making that
got us into this economic mess in the first place.�
Mining
The extent to which the Irish Government has bent over
backwards to attract foreign investment in mining - and in
the process delimit its share of potential income - can be
seen in an extract from a Government Report [13] titled
�Land of Mineral Opportunities�, [14] published in May 2006.
�Tax incentives relevant to exploration and mining in
Ireland include:
*No State Shareholding in the Project and No Royalties are
Payable to the State.
*Immediate write-off of development and exploration
expenditure
*Corporation Tax of 25 percent (reducing to 12.5% for
downstream manufacturing)
*Capital Allowance of up to 120 percent
*Expenditure on rehabilitation of mine sites after closure
is tax-deductible
*There are no restrictions on foreign investment in Ireland,
*There are no restrictions with capital repatriation from
the State.�
Oil and Natural Gas
Over the past 15 years gas and oil [15] have been discovered
under Irish waters in the Atlantic [16] Ocean. However, the
government�s �Minister Ray Burke (later jailed for
corruption) changed the law in 1987, reducing the State�s
share in our offshore oil and gas from 50% to zero and
abolishing royalties.
In 1992, Minister Bertie Ahern reduced the tax rate for the
profits made from the sale of these resources from 50% to
25%.� In May of this year [2012], an article [17] by
economist Colm Rapple stated that a committee that included
12 TDs [MPs] and senators from Government parties and nine
from the opposition thought that �the terms at which we give
away rights to potential offshore oil and gas reserves are
far too generous. [�] They want far tougher terms applied to
all new licences.�
2016
So how will the government square this dismal history of
giveaways with the upcoming centenary of the 1916 Rising in
2016, an attempted revolution which was initiated with a
proclamation [18] read out in the centre of Dublin declaring
�the right of the people of Ireland to the ownership of
Ireland, and to the unfettered control of Irish destinies,
to be sovereign and indefeasible. The long usurpation of
that right by a foreign people and government has not
extinguished the right, nor can it ever be extinguished
except by the destruction of the Irish people.�
This declaration was followed up in 1922 with The
Constitution [19] of the Irish Free State (Saorst�t Eireann)
Act, 1922 which stated in Article 11 that �All the lands and
waters, mines and minerals, within the territory of the
Irish Free State hitherto vested in the State, or any
department thereof, or held for the public use or benefit,
and also all the natural resources of the same territory
(including the air and all forms of potential energy), and
also all royalties and franchises within that territory
shall, from and after the date of the coming into operation
of this constitution, belong to the Irish Free State�.
The future?
There seems to be no limit to the government�s sticky
fingers. The National Pensions Reserve Fund [20] has seen
its total value reduce from �24.4 billion in 2010 [21] to �
15.1 billion in 2012 with �20.7 billion of the fund [22]
spent on preference shares and ordinary shares in Allied
Irish Banks and Bank of Ireland since 2009.
As the government props up the banks and pays off unsecured
bondholders, it is likely that the forthcoming significant
national commemorations will refocus the Irish people on
past conceptions of national democracy. Chicken, anybody?
New Study - Angling worth �0.75 billion to Irish Economy and
supporting 10,000 jobs in rural Ireland
Scale and value of Ireland�s angling resource greatly under
appreciated - Minister O�Dowd
The Minister of State with Responsibility for
Natural Resources, Fergus O� Dowd T.D. today warmly welcomed
the findings of a new national economic study which has
revealed for the first time that angling and angling tourism
in Ireland is generating a dividend in excess of �0.75
billion within the Irish economy every year.
The study, commissioned by Inland Fisheries Ireland, shows
direct spending on angling in Ireland amounted to �555
million in 2012, with indirect spending worth an additional
�200 million and totaling �755 million. Recreational angling
was also found to directly support 10,000 existing Irish
jobs, many of which are located in the most peripheral and
rural parts of the Irish countryside and along our
coastline.
The Study found that 406,000 people were involved in
recreational angling in Ireland last year, with over 150,000
of these travelling from Northern Ireland and overseas. Over
a quarter of a million Irish adults (252,000) held a fishing
rod last year with sea angling along with salmon and brown
trout angling seen as the most popular categories where
domestic anglers are concerned. The quality of the Irish
angling product, the friendliness and hospitality of the
Irish people and our outstanding scenery were cited amongst
the principal attractions of Ireland as an international
destination for recreational angling. Tourism angling spend
is estimated at approximately �280 million on an annual
basis.
http://www.fisheriesireland.ie/Press-releases/new-study-angling-worth-075-billion-to-irish-economy-and-supporting-10000-jobs-in-rural-ireland.html
European government's combined debt figures are out today.
How bad are they?
Europe government
debt: who owes what? Photograph:
Julien Behal/PA Wire
�10,320,106,100,000: that is the
total amount owed by the 27 governments of
the European Union. Published today on a
quarterly basis for the first time, the
figures show a big increase across the
contitnent - up from 60.3% of GDP in Q3 2008
to a whopping 82.2% now.
Of that debt,
�8.2tn is owed by governments in the
eurozone - which is marginally down in the
last quarter but still represents 87.4% of
those countries' combined GDP. And is up
from 67.7% in 2008.
The key data
here is from
Eurostat - the first time this has been
published quarterly
The overall
figures show how big rises in debt at the
start of the crisis have slowed, with
countries such as the UK, France and
Germany, bunching around the same place. It
also shows Greece's debt shooting up. Italy
has remained surprisingly consistent over
the whole period, as Berlusconi allowed his
country's debt to grow in line with its GDP.
Eurozone debt has fallen for
first time since 2007
Colm Kelpie � Published 22 January
2014 11:32 AM
IRELAND had the fourth highest government debt in Europe at the end of
September last year, according to the latest data released by Eurostat.
Government debt in the Eurozone fell for the first time since the end of
2007. At the end of the third quarter, the debt-to-GDP average for the
euro area was 92.7pc.
This is compared to 93.4pc in the previous quarter.
Ireland�s debt level was 124.8pc at the end of September. Debt-riddled
Greece had the highest at 171.8pc, followed by Italy at 132.9pc, and
Portugal at 128.7pc.
In the Budget, the Government forecast debt levels to fall to 120pc at
the end of this year, dropping to 118.4pc at the end of 2015 and falling
further to 114.6pc at the end of 2016. It is projected to fall to 93pc
by 2020.
The countries with the lowest debt-to-GDP ratio at the end of last
September included Estonia at 10pc, Bulgaria at 17.3pc and Luxembourg at
27.7pc.
Europe's three biggest economies saw its debt fall, with Germany down to
78.4pc of its GDP and France down to 92.7pc.
Debt the bloc's third largest economy Italy dropped to 132.9pc from its
peak of 133.3pc in the previous quarter, but it remains the euro zone's
second highest after Greece.
The level of debt in a majority of eurozone countries remains well above
the European Union's official limit of 60pc of the value of their
economies.
Transatlantic
Trade and Investment Partnership (TTIP)
The Transatlantic Trade
and Investment Partnership (TTIP) is a trade agreement that
is presently being negotiated between the European Union and
the United States.
It aims at removing trade barriers in a wide range of
economic sectors to make it easier to buy and sell goods and
services between the EU and the US.
On top of cutting tariffs across all sectors, the EU and the
US want to tackle barriers behind the customs border � such
as differences in technical regulations, standards and
approval procedures. These often cost unnecessary time and
money for companies who want to sell their products on both
markets. For example, when a car is approved as safe in the
EU, it has to undergo a new approval procedure in the US
even though the safety standards are similar.
The TTIP negotiations will also look at opening both markets
for services, investment, and public procurement. They could
also shape global rules on trade.
What is TTIP? And six reasons
why the answer should scare you
LEE WILLIAMS Tuesday 7 October
2014
The Transatlantic Trade and Investment
Partnership is a series of trade negotiations being carried
out mostly in secret between the EU and US. As a bi-lateral
trade agreement, TTIP is about reducing the regulatory
barriers to trade for big business, things like food safety
law, environmental legislation, banking regulations and the
sovereign powers of individual nations. It is, as John
Hilary, Executive Director of campaign group War on Want,
said: �An assault on European and US societies by
transnational corporations.�
Since before TTIP negotiations began last February, the
process has been secretive and undemocratic. This secrecy is
on-going, with nearly all information on negotiations coming
from leaked documents and Freedom of Information requests.
But worryingly, the covert nature of the talks may well be
the least of our problems. Here are six other reasons why we
should be scared of TTIP, very scared indeed:
1 The NHS
Public services, especially the NHS, are in the firing line.
One of the main aims of TTIP is to open up Europe�s public
health, education and water services to US companies. This
could essentially mean the privatisation of the NHS.
The European Commission has claimed that public services
will be kept out of TTIP. However, according to the
Huffington Post, the UK Trade Minister Lord Livingston has
admitted that talks about the NHS were still on the table.
2 Food and environmental safety
TTIP�s �regulatory convergence� agenda will seek to bring EU
standards on food safety and the environment closer to those
of the US. But US regulations are much less strict, with 70
per cent of all processed foods sold in US supermarkets now
containing genetically modified ingredients. By contrast,
the EU allows virtually no GM foods. The US also has far
laxer restrictions on the use of pesticides. It also uses
growth hormones in its beef which are restricted in Europe
due to links to cancer. US farmers have tried to have these
restrictions lifted repeatedly in the past through the World
Trade Organisation and it is likely that they will use TTIP
to do so again.
The same goes for the environment, where the EU�s REACH
regulations are far tougher on potentially toxic substances.
In Europe a company has to prove a substance is safe before
it can be used; in the US the opposite is true: any
substance can be used until it is proven unsafe. As an
example, the EU currently bans 1,200 substances from use in
cosmetics; the US just 12.
3 Banking regulations
TTIP cuts both ways. The UK, under the influence of the
all-powerful City of London, is thought to be seeking a
loosening of US banking regulations. America�s financial
rules are tougher than ours. They were put into place after
the financial crisis to directly curb the powers of bankers
and avoid a similar crisis happening again. TTIP, it is
feared, will remove those restrictions, effectively handing
all those powers back to the bankers.
4 Privacy
Remember ACTA (the Anti-Counterfeiting Trade Agreement)? It
was thrown out by a massive majority in the European
Parliament in 2012 after a huge public backlash against what
was rightly seen as an attack on individual privacy where
internet service providers would be required to monitor
people�s online activity. Well, it�s feared that TTIP could
be bringing back ACTA�s central elements, proving that if
the democratic approach doesn�t work, there�s always the
back door. An easing of data privacy laws and a restriction
of public access to pharmaceutical companies� clinical
trials are also thought to be on the cards.
5 Jobs
The EU has admitted that TTIP will probably cause
unemployment as jobs switch to the US, where labour
standards and trade union rights are lower. It has even
advised EU members to draw on European support funds to
compensate for the expected unemployment.
Examples from other similar bi-lateral trade agreements
around the world support the case for job losses. The North
American Free Trade Agreement (NAFTA) between the US, Canada
and Mexico caused the loss of one million US jobs over 12
years, instead of the hundreds of thousands of extra that
were promised.
6 Democracy
TTIP�s biggest threat to society is its inherent assault on
democracy. One of the main aims of TTIP is the introduction
of Investor-State Dispute Settlements (ISDS), which allow
companies to sue governments if those governments� policies
cause a loss of profits. In effect it means unelected
transnational corporations can dictate the policies of
democratically elected governments.
ISDSs are already in place in other bi-lateral trade
agreements around the world and have led to such injustices
as in Germany where Swedish energy company Vattenfall is
suing the German government for billions of dollars over its
decision to phase out nuclear power plants in the wake of
the Fukushima disaster in Japan. Here we see a public health
policy put into place by a democratically elected government
being threatened by an energy giant because of a potential
loss of profit. Nothing could be more cynically
anti-democratic.
There are around 500 similar cases of businesses versus
nations going on around the world at the moment and they are
all taking place before �arbitration tribunals� made up of
corporate lawyers appointed on an ad hoc basis, which
according to War on Want�s John Hilary, are �little more
than kangaroo courts� with �a vested interest in ruling in
favour of business.�
Caoimhghin � Croidhe�in is an
Irish artist who has exhibited widely around Ireland. His
work consists of paintings based on cityscapes of Dublin,
Irish history and geopolitical themes (http://gaelart.net/).
His blog of critical writing based on cinema, art and
politics along with research on a database of Realist and
Social Realist art from around the world can be viewed
country by country at
http://gaelart.blogspot.ie/.
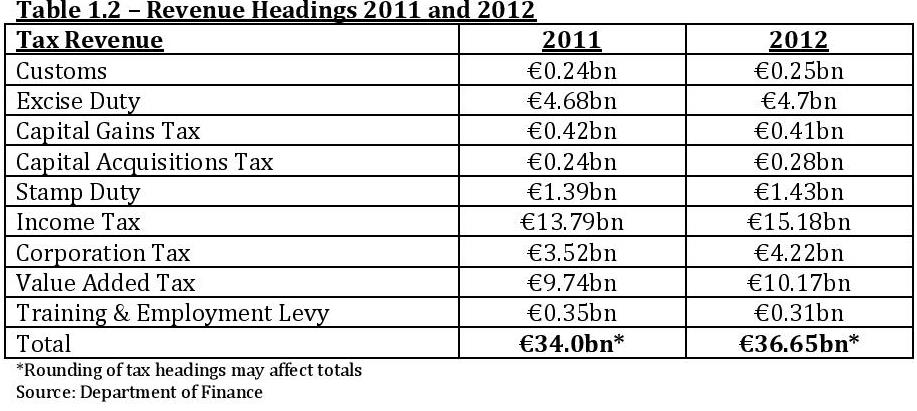
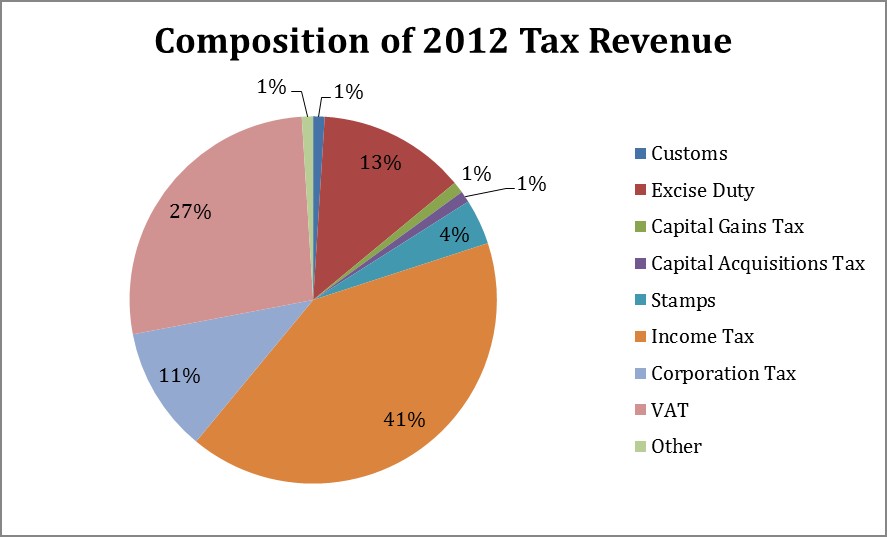
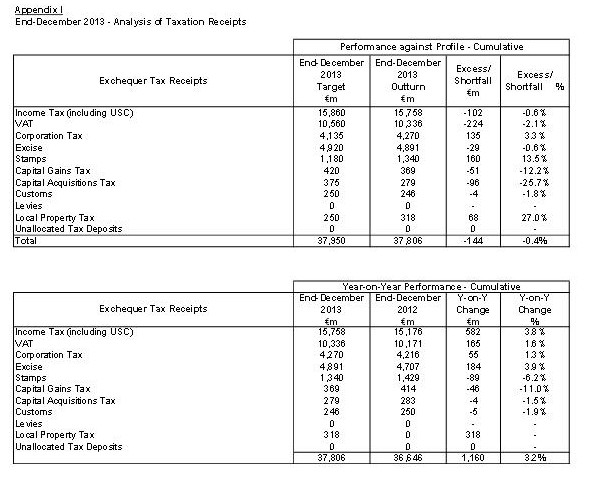
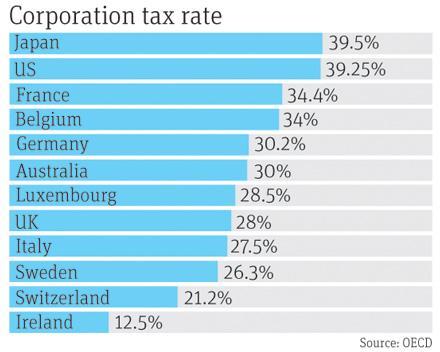
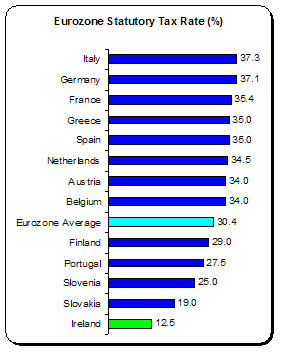
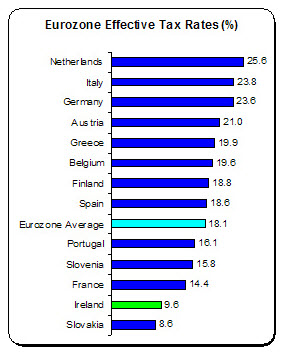
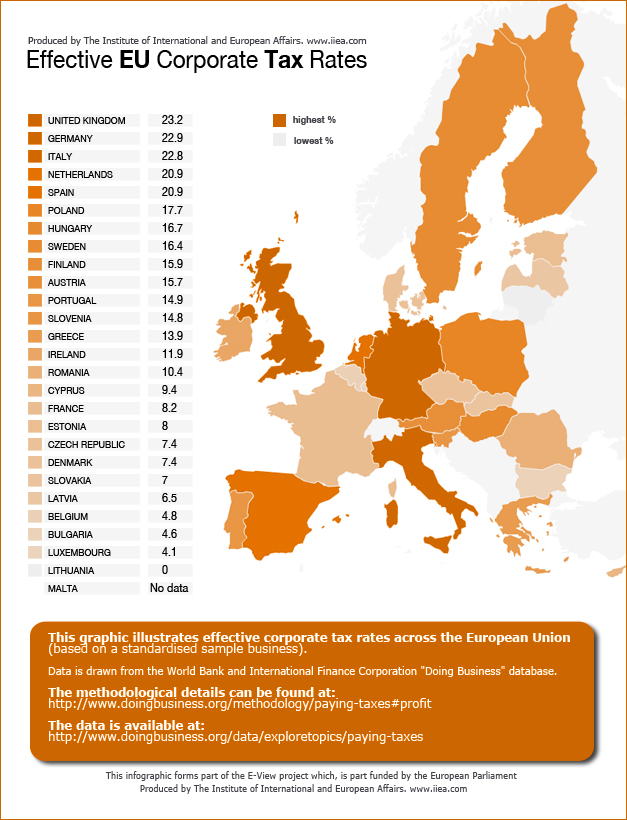
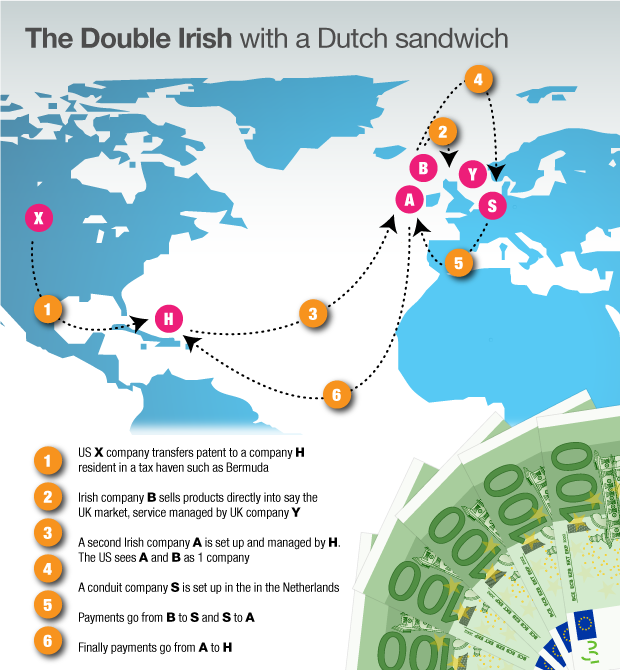
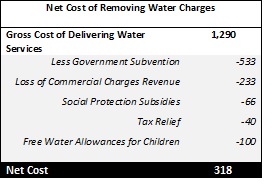
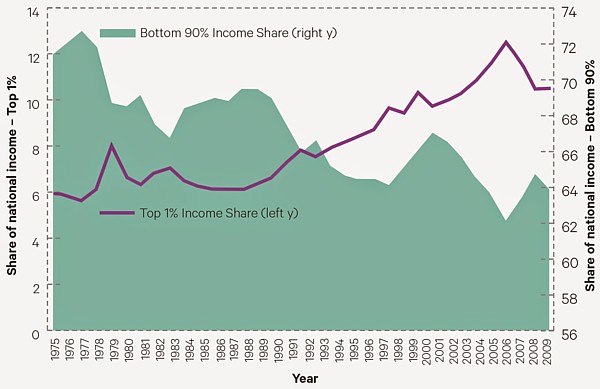
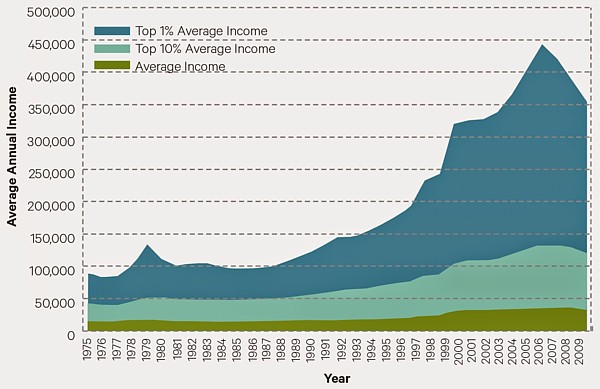
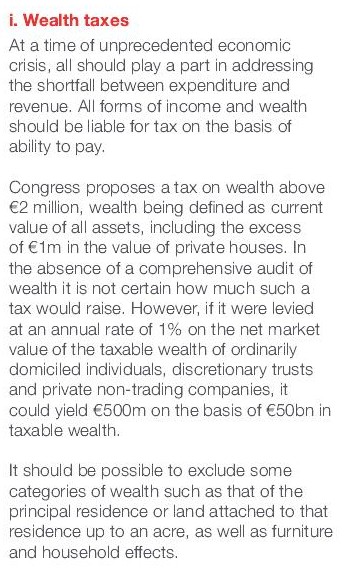

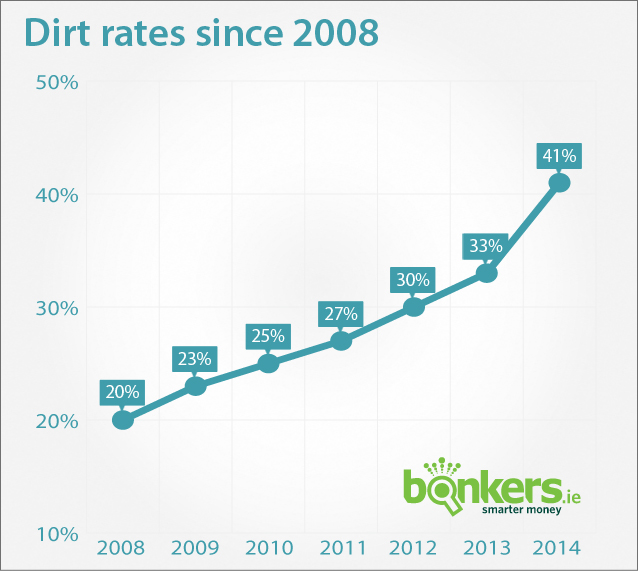
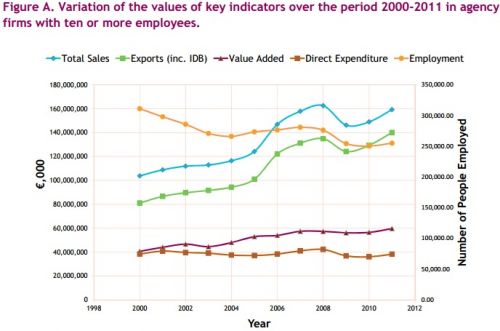
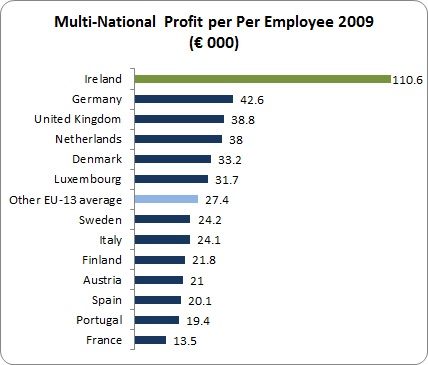
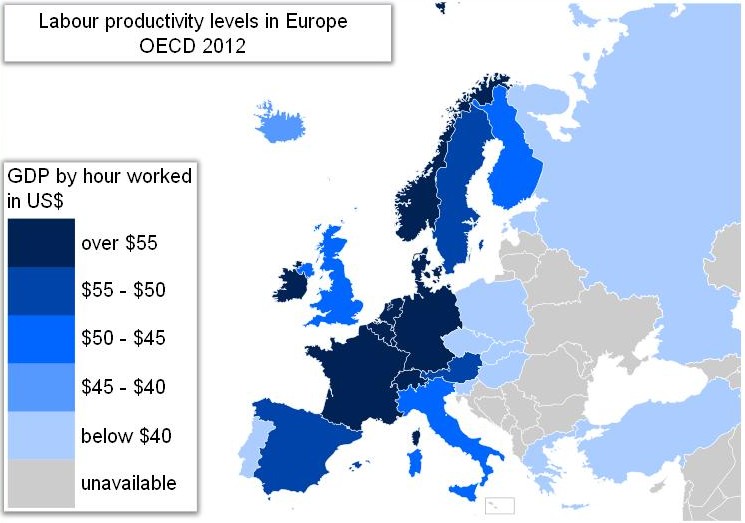
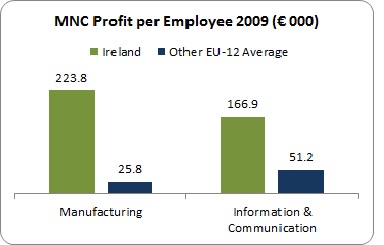
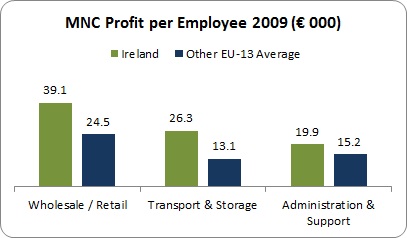
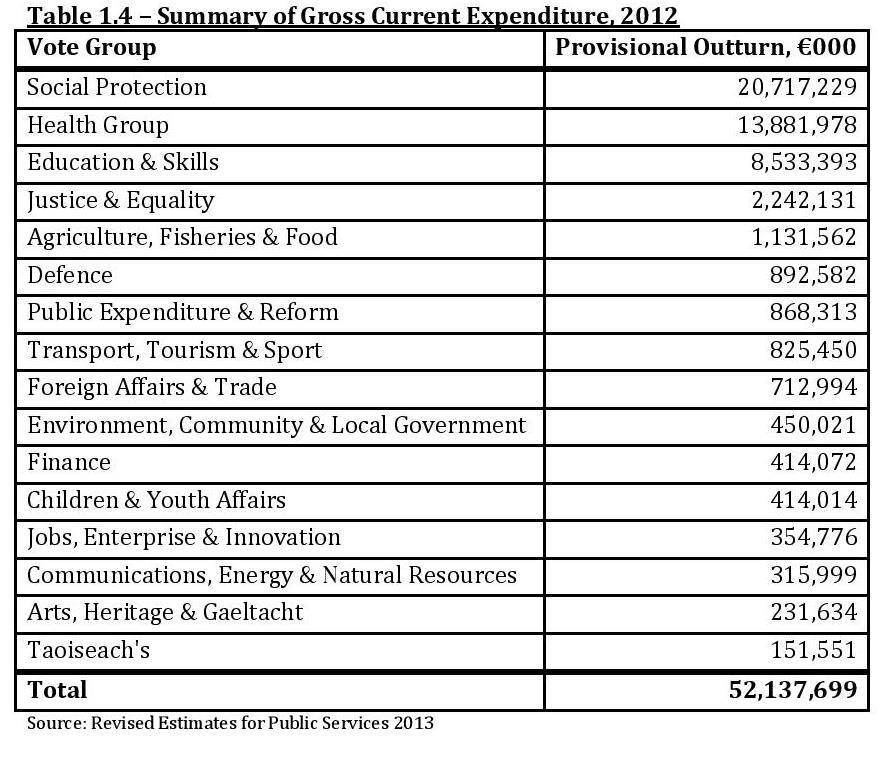
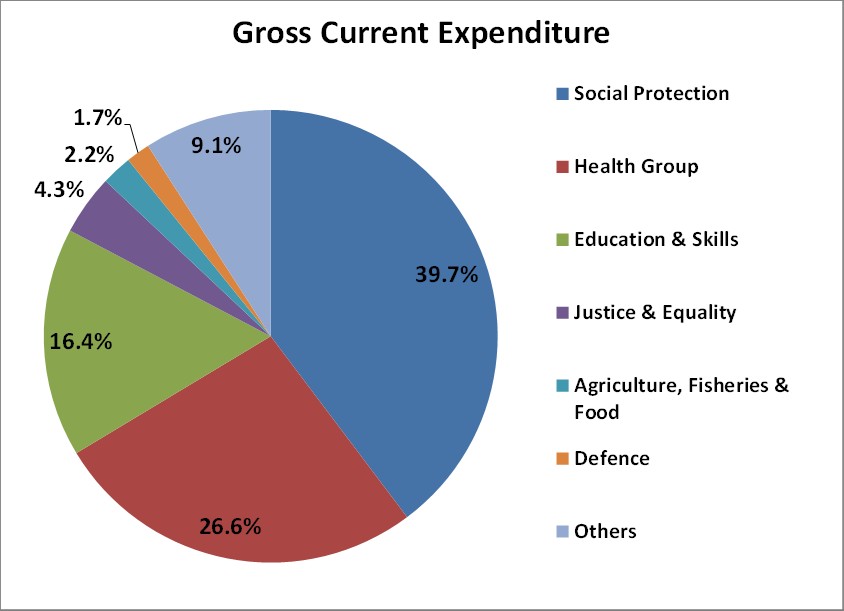
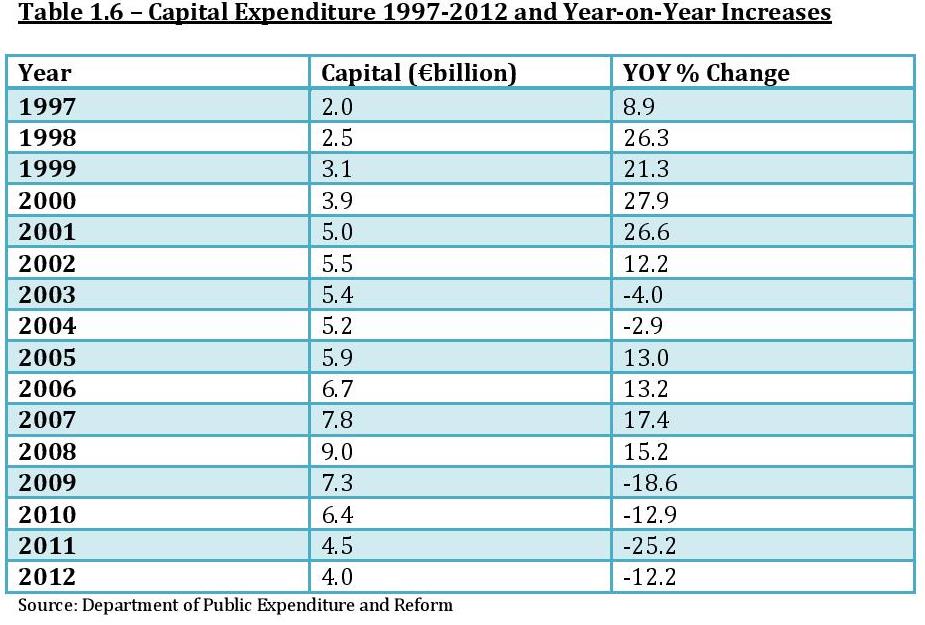
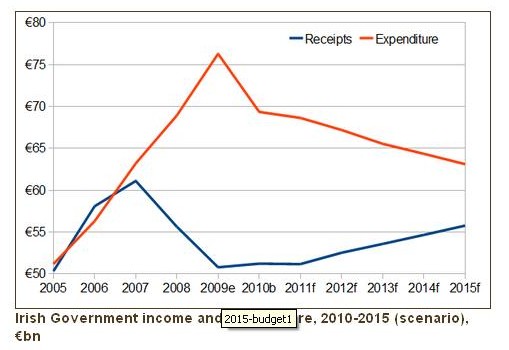
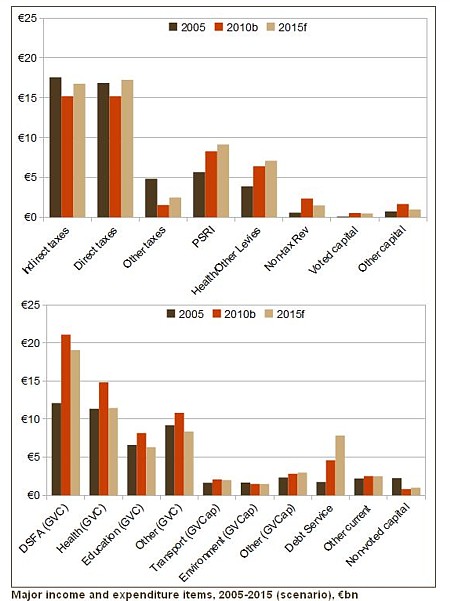
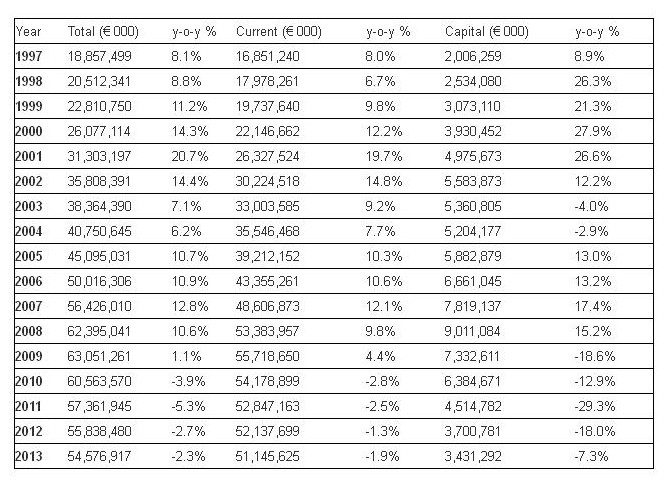
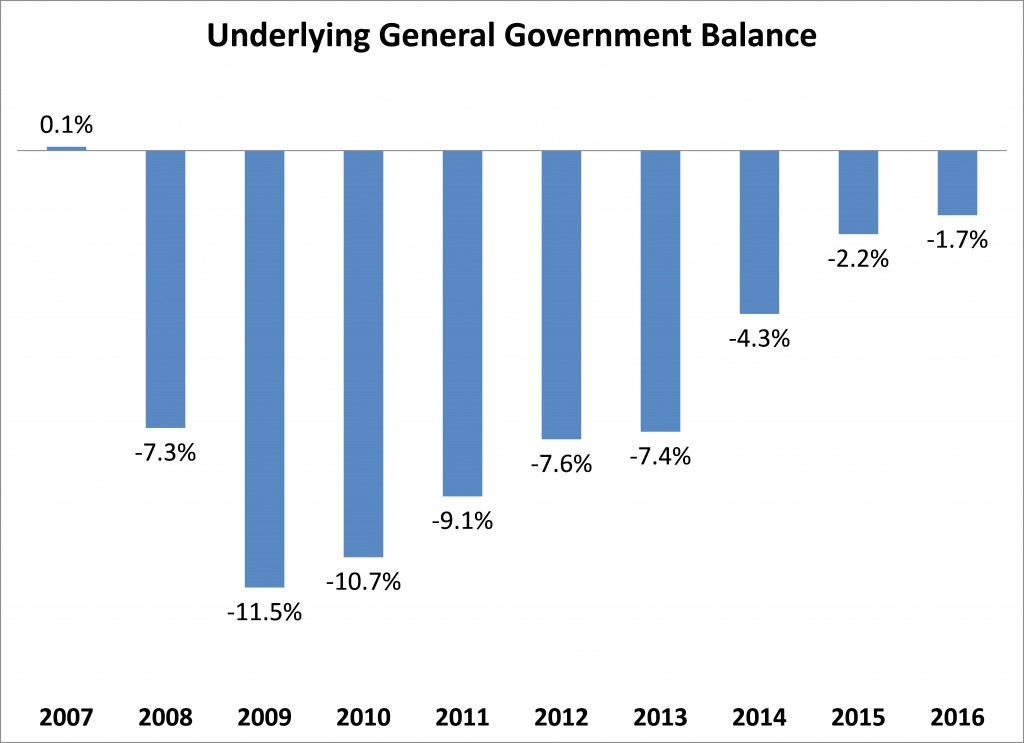
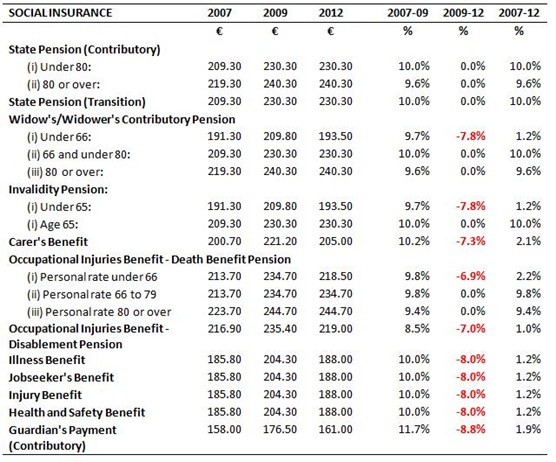
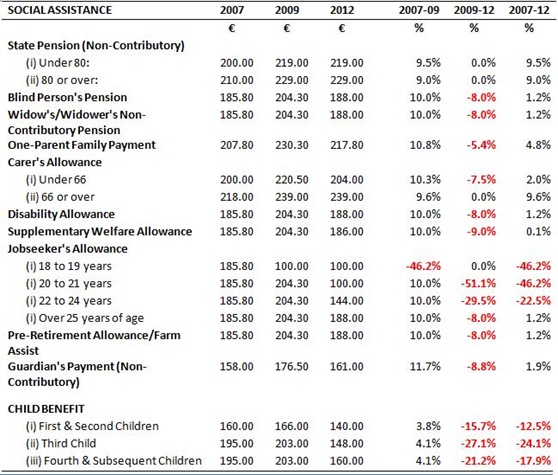
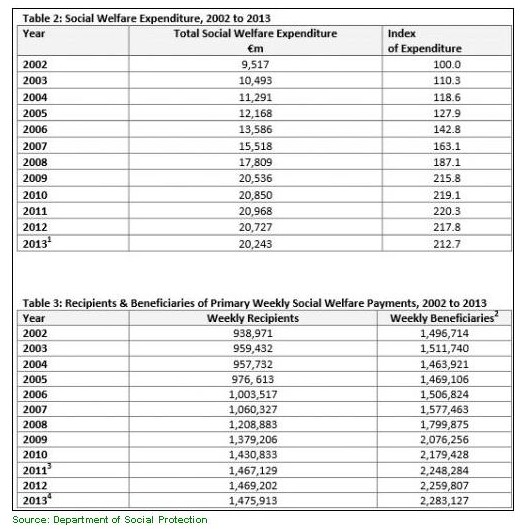
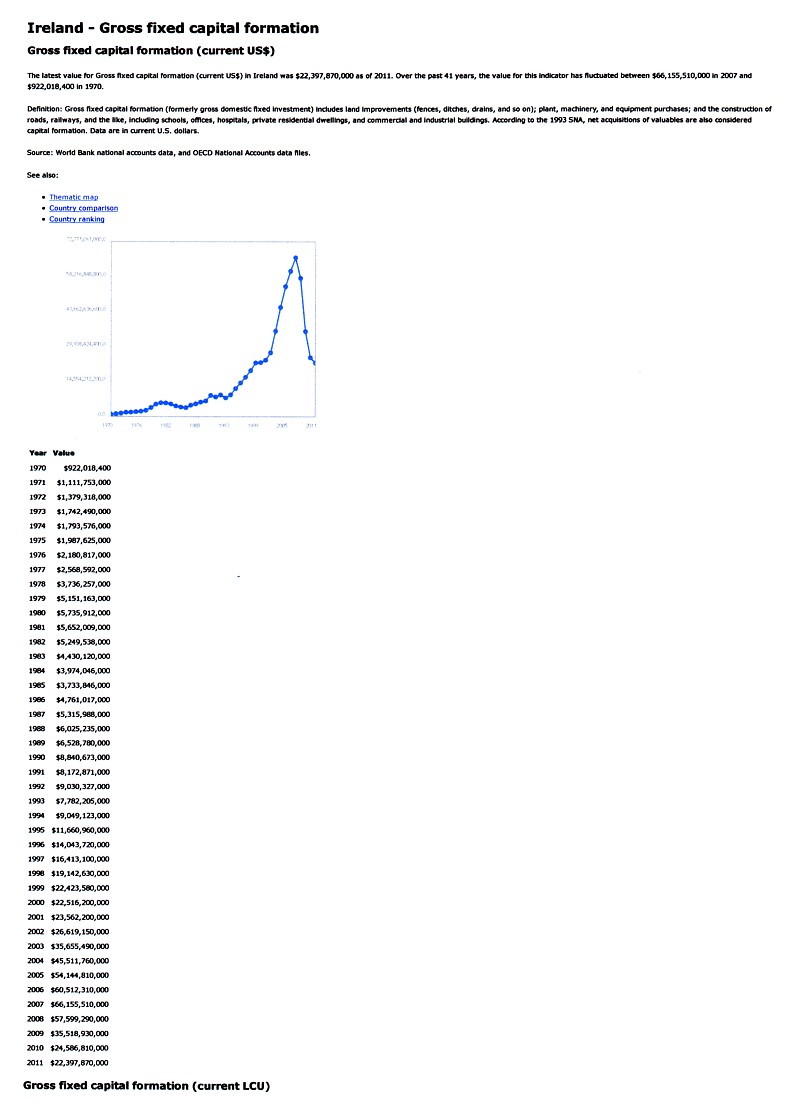
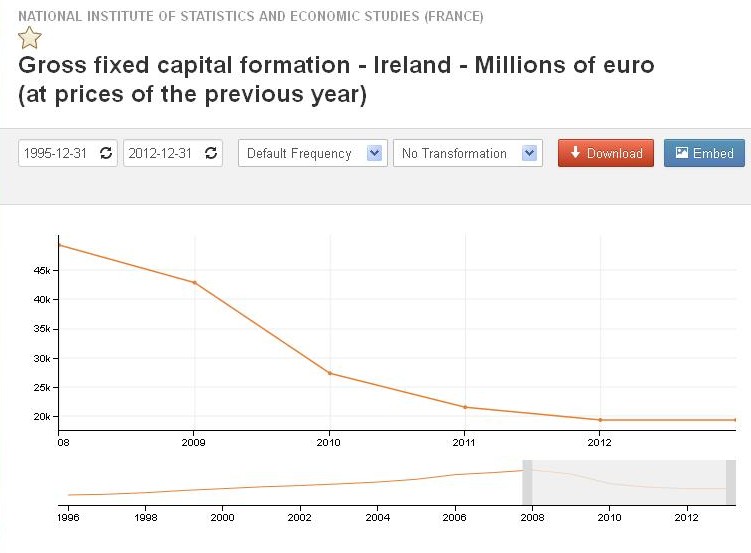
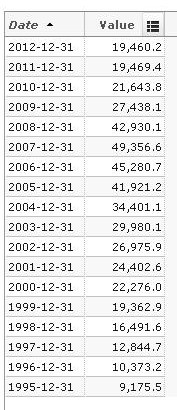
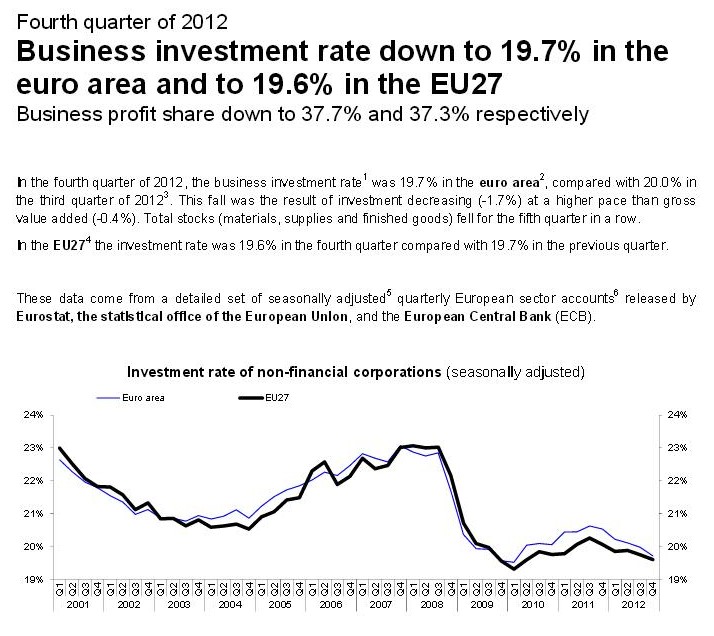
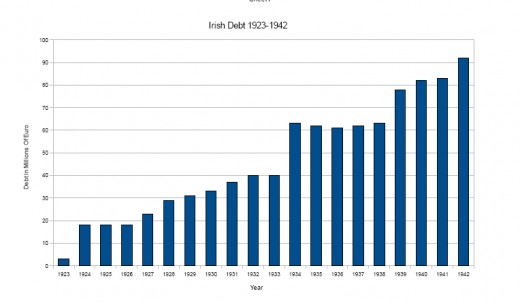
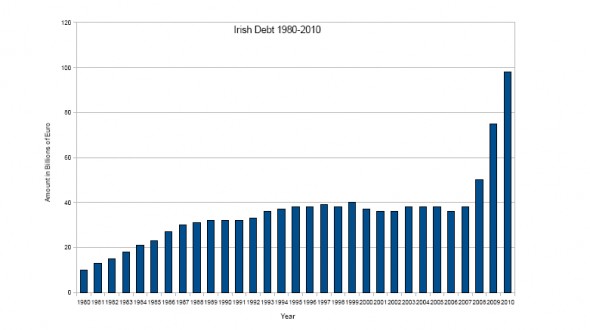
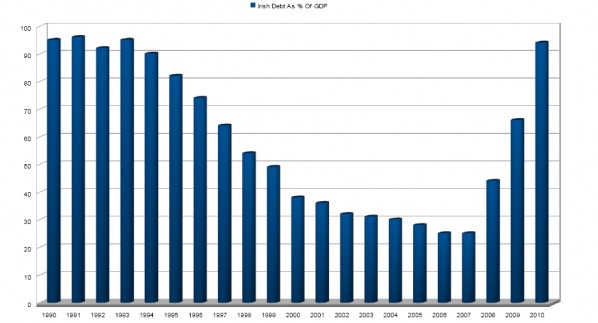
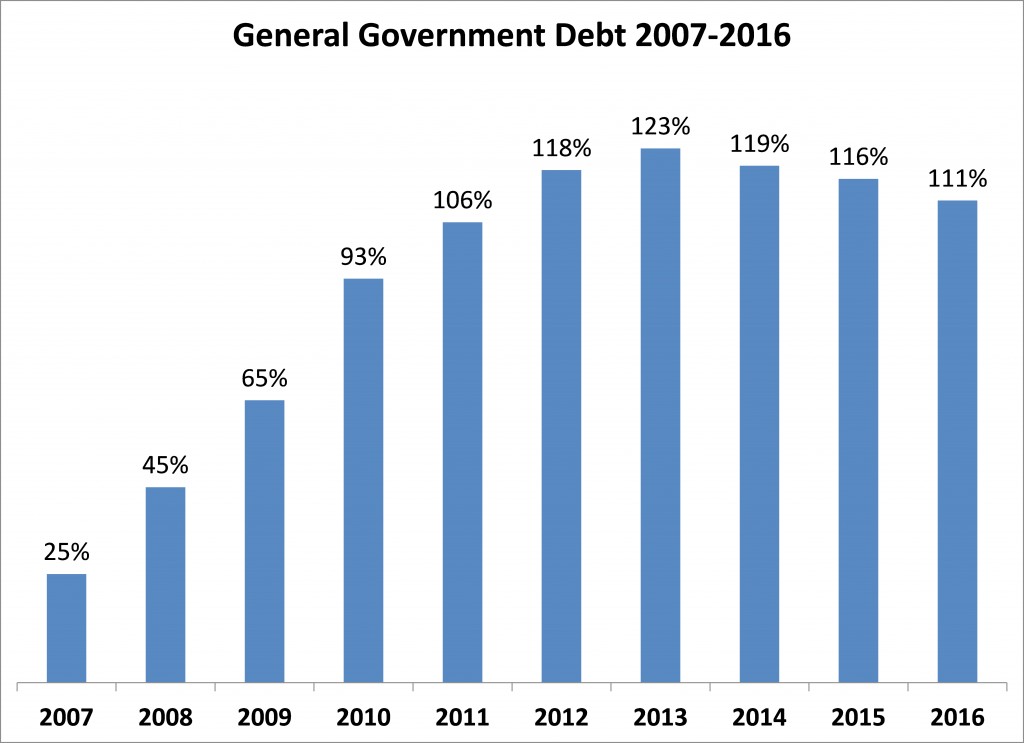
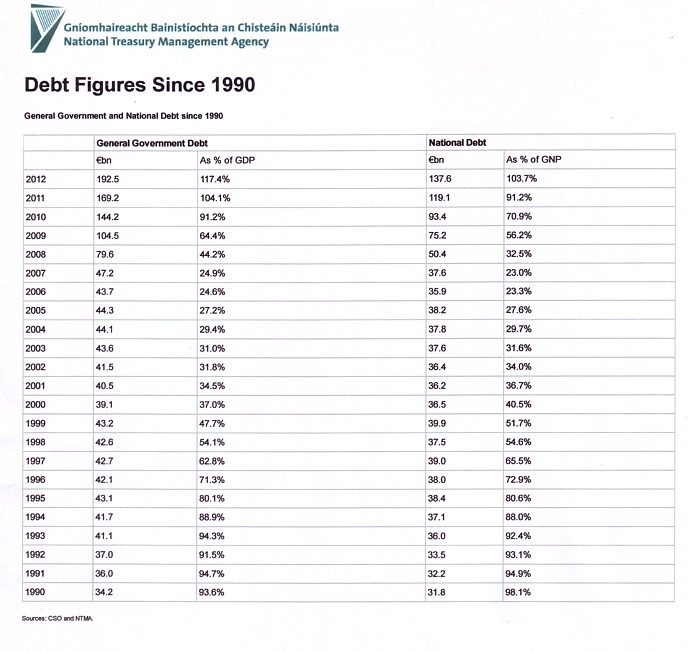
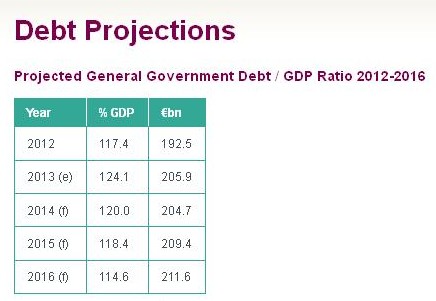
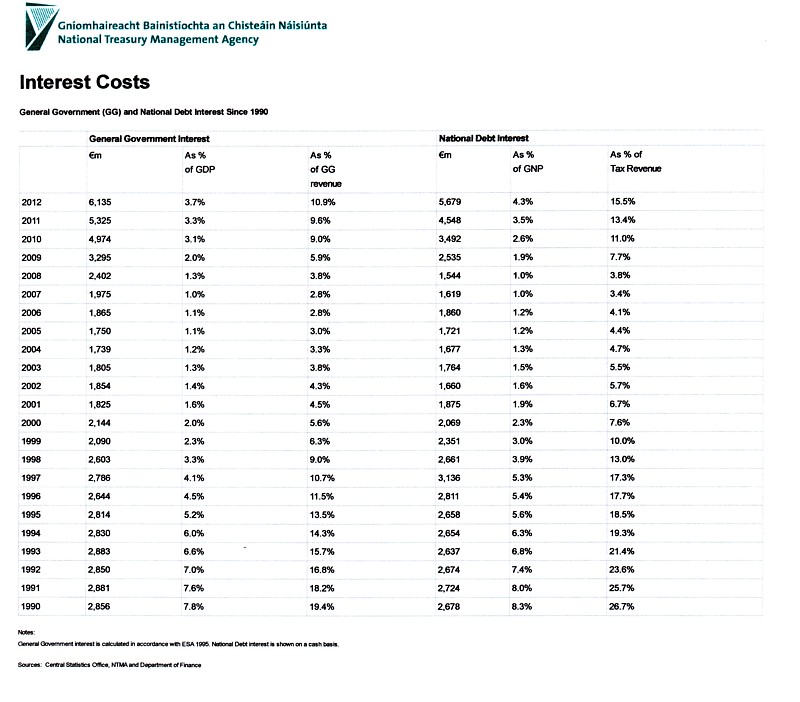
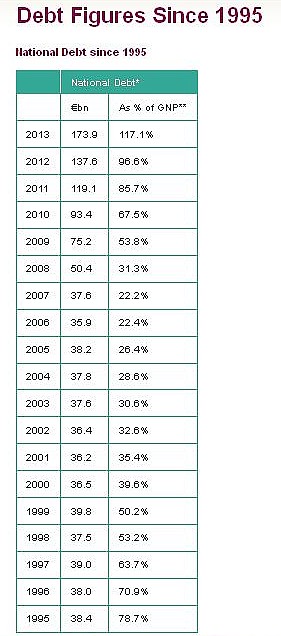
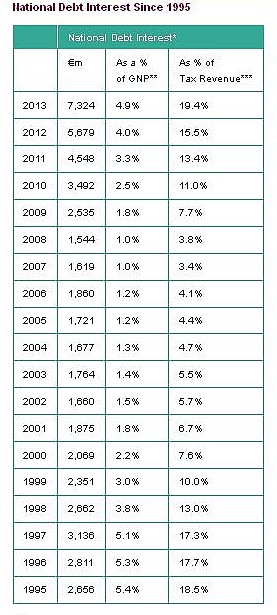
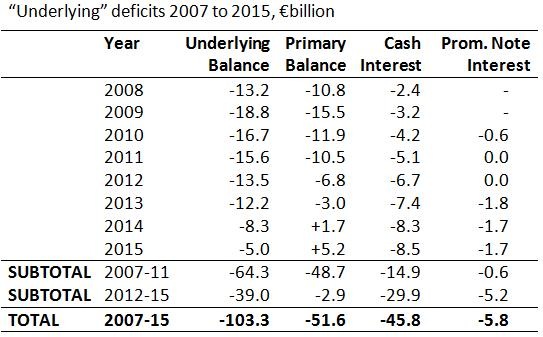
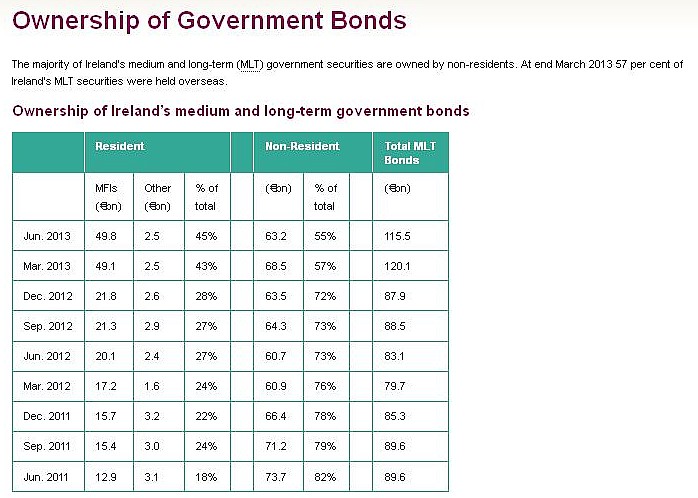
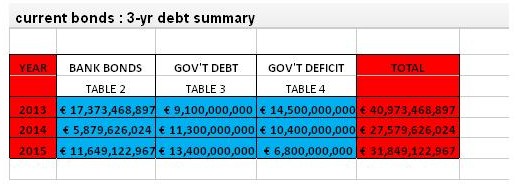
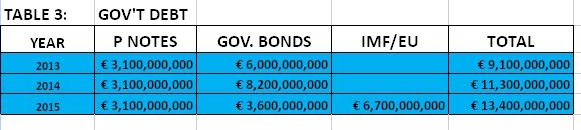
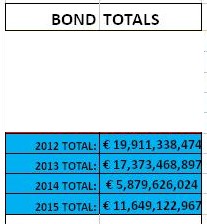
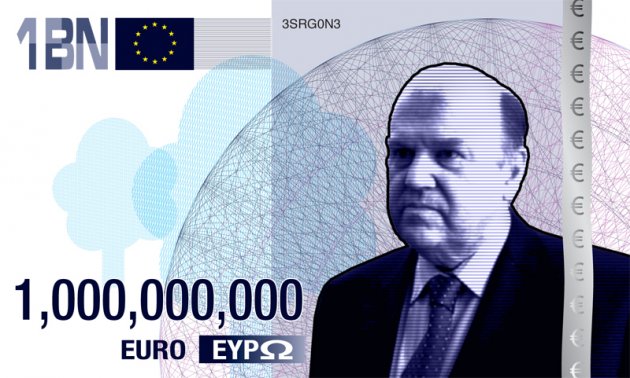
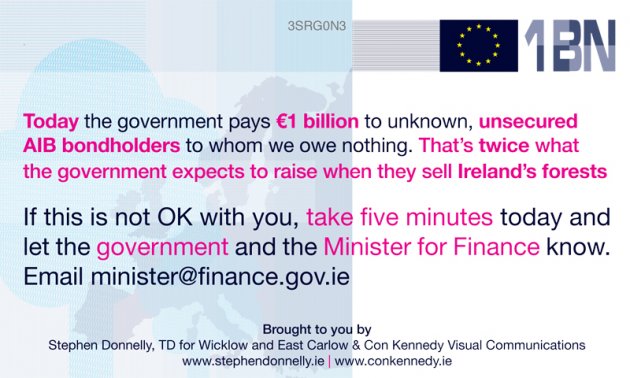
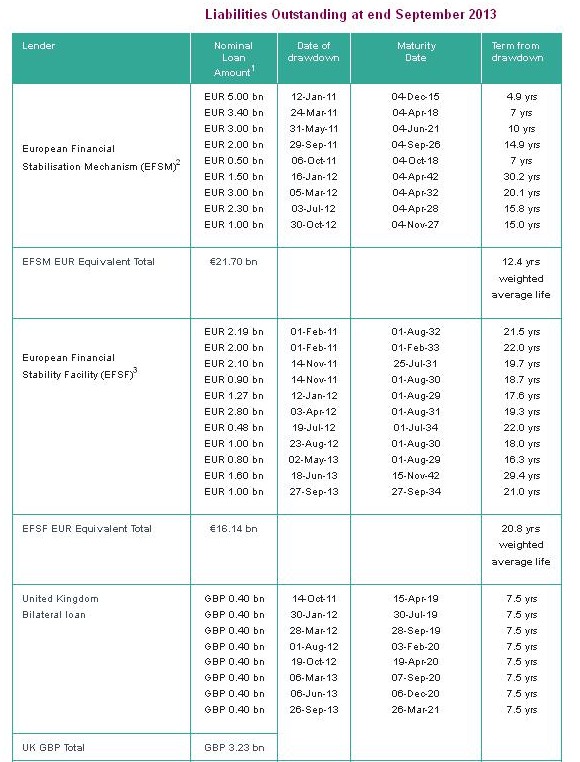
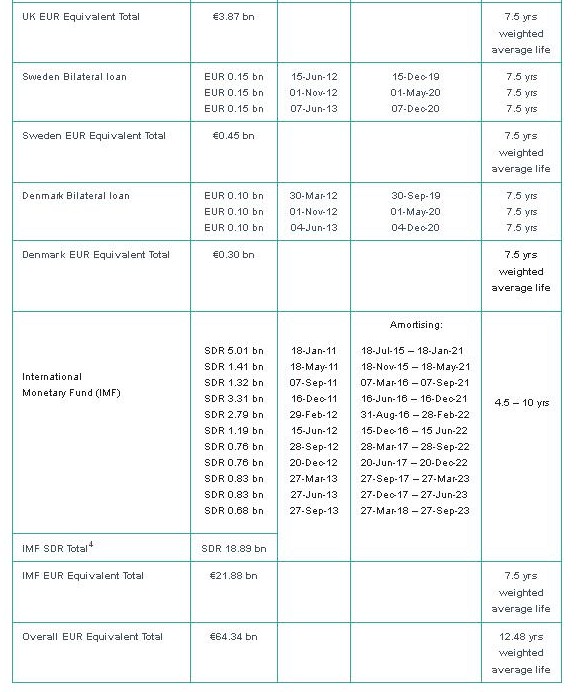
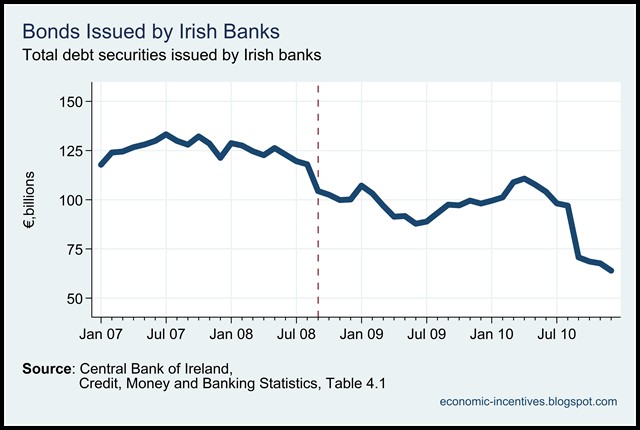
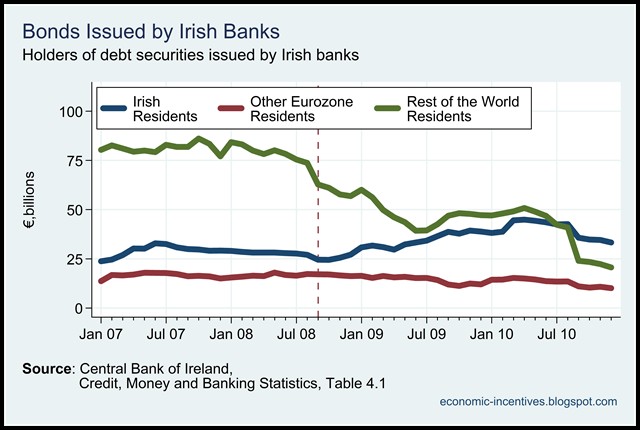
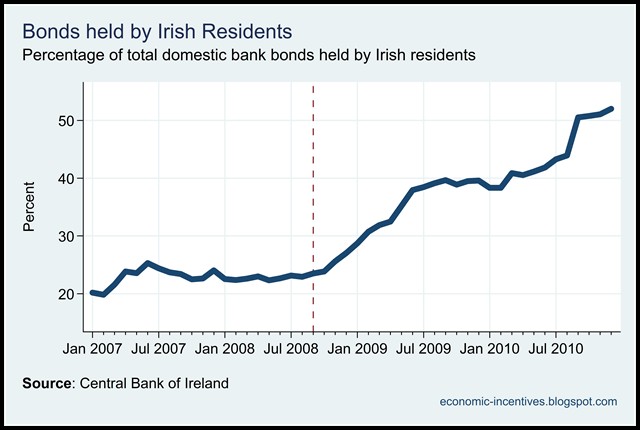
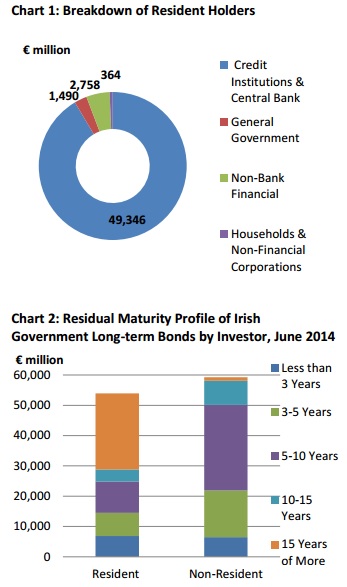
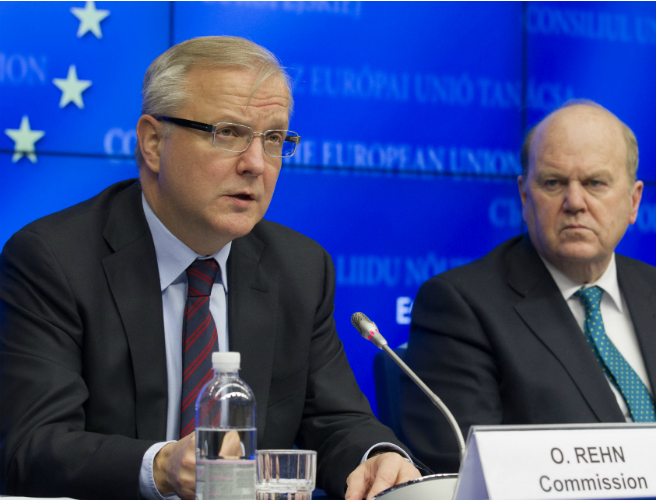

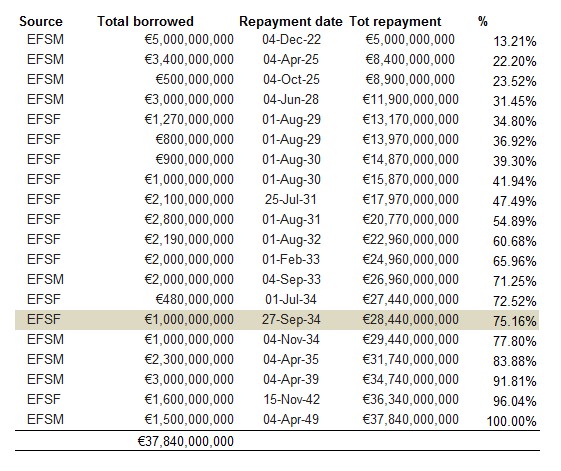
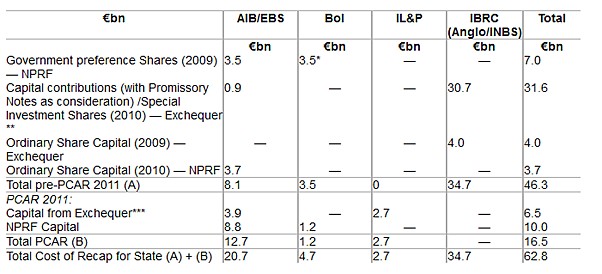
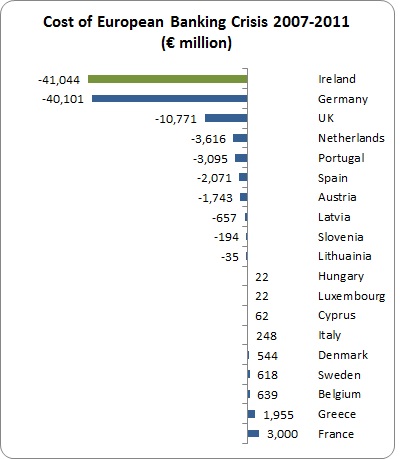
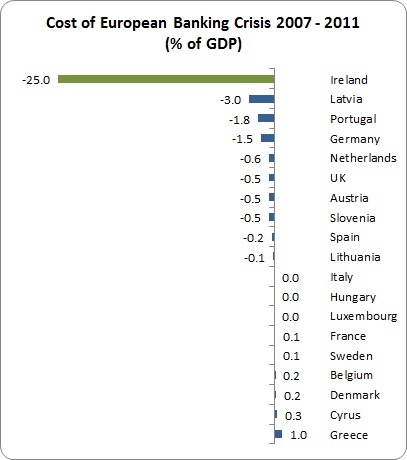
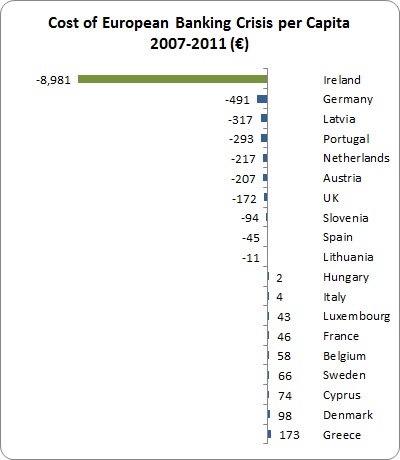
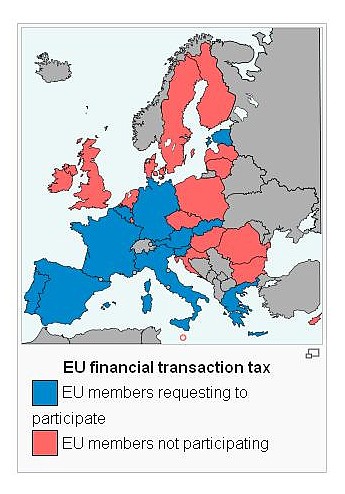
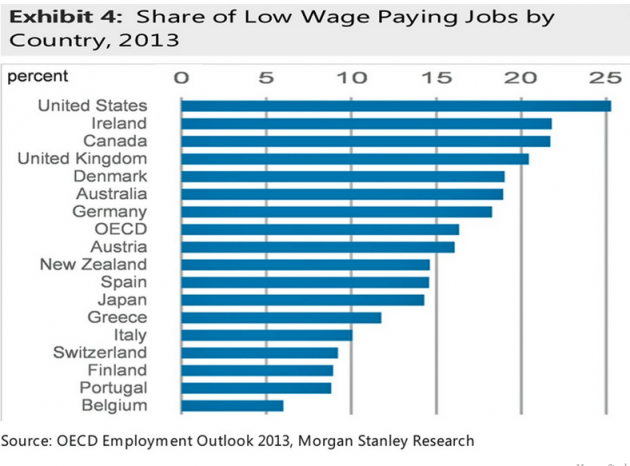
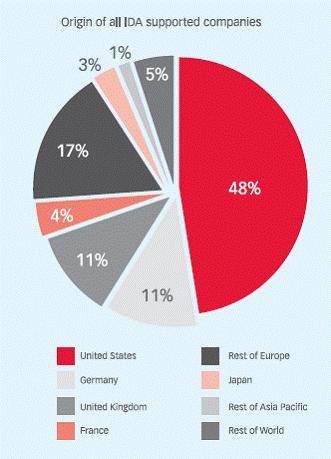
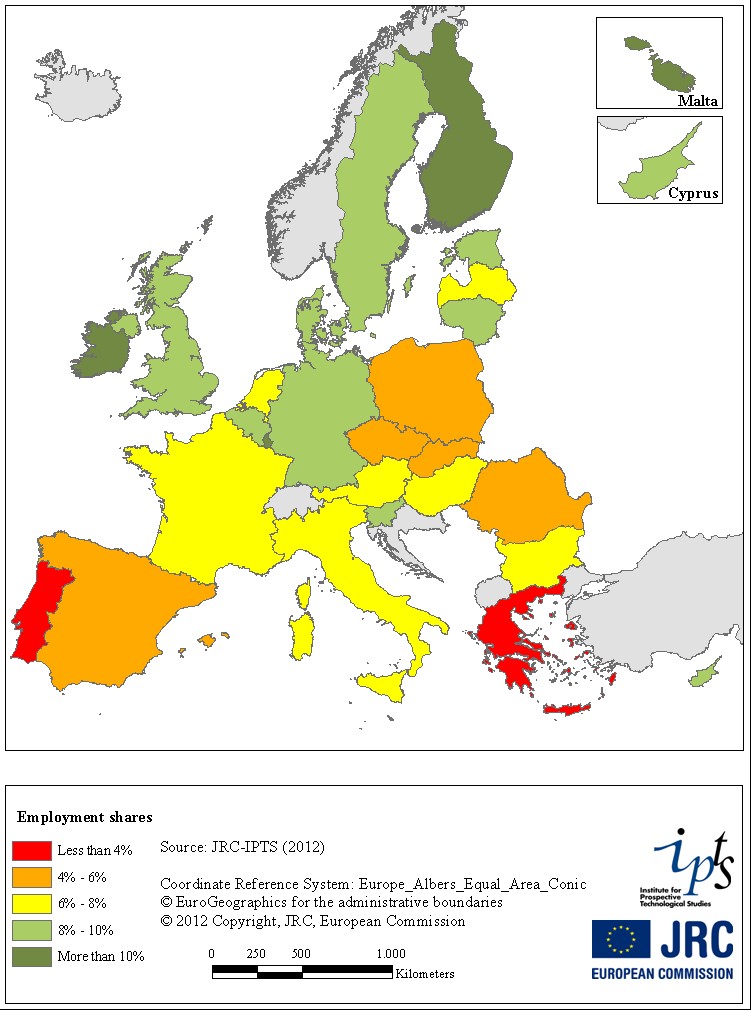
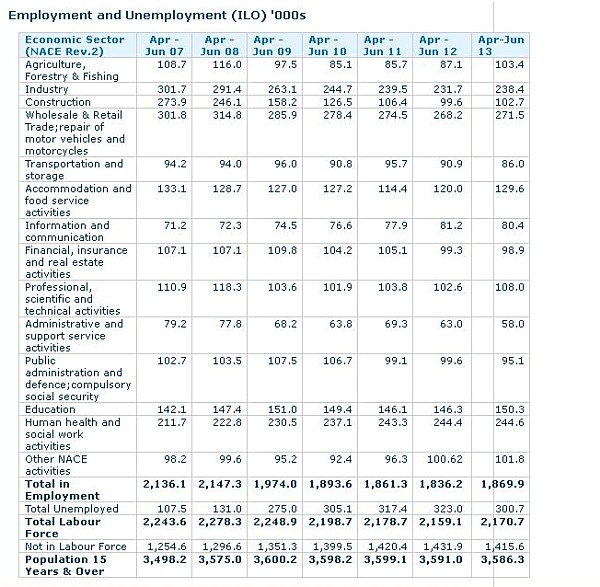
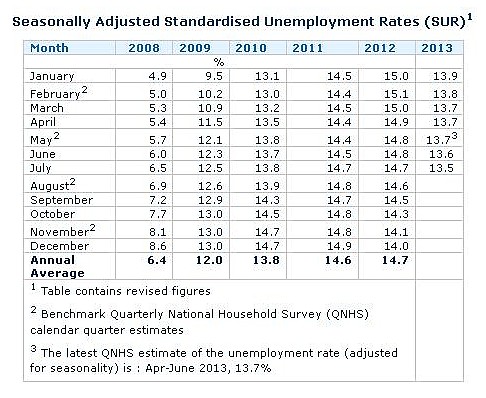
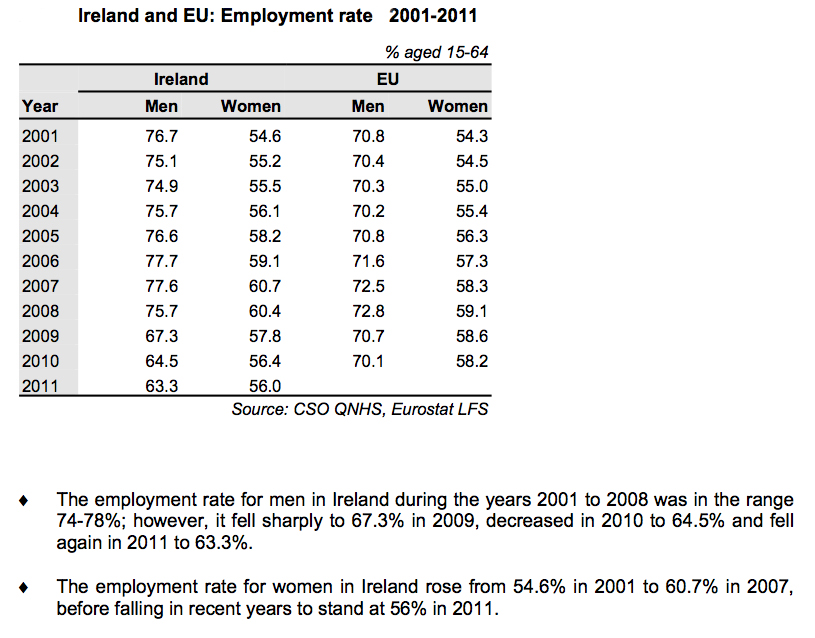
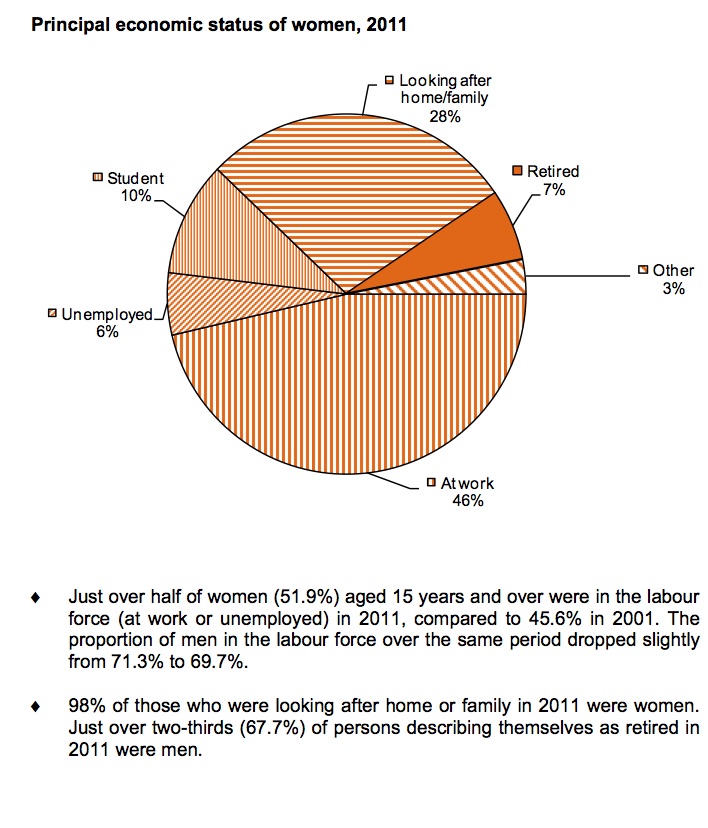

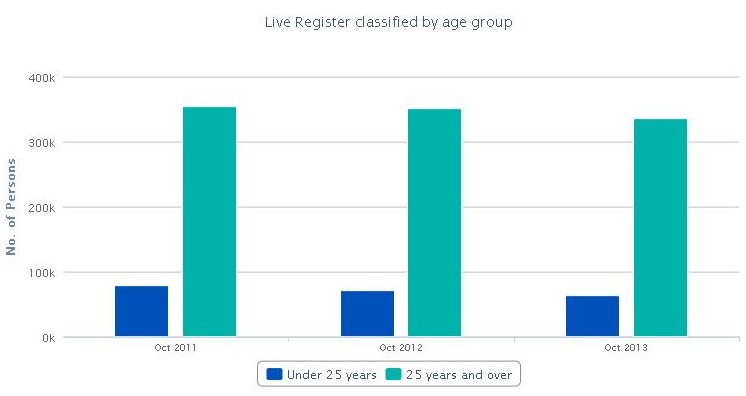
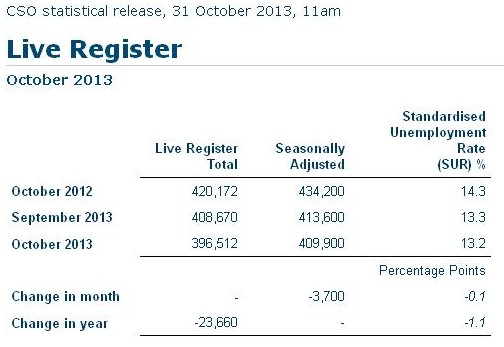
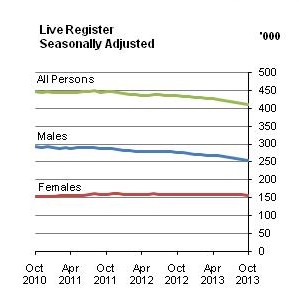
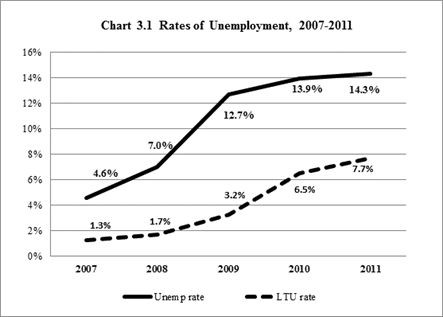
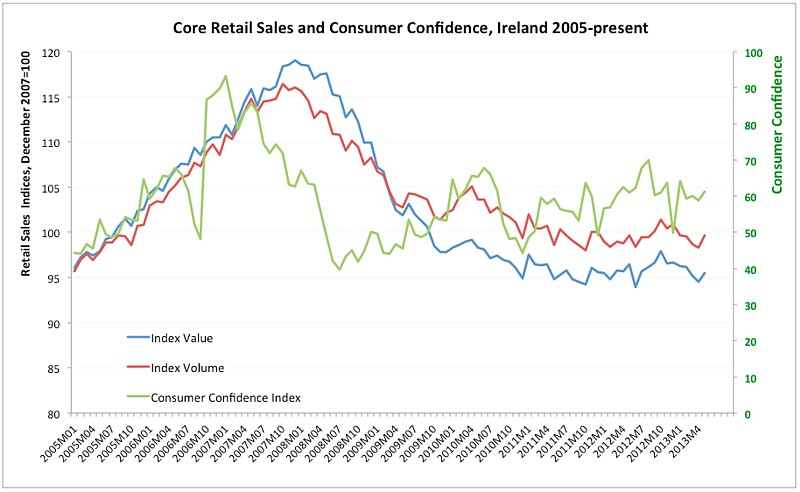
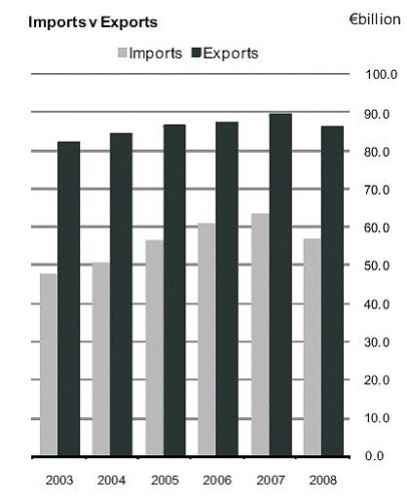
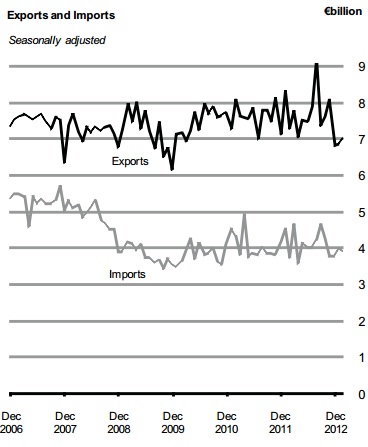
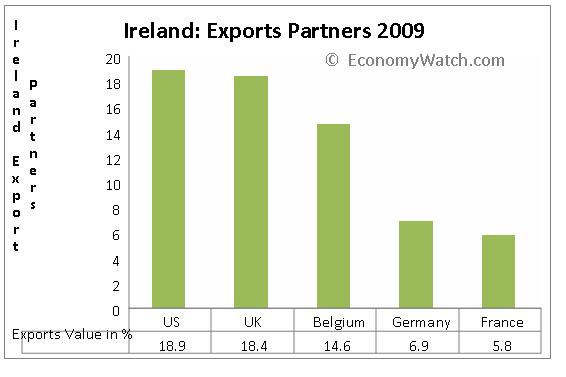
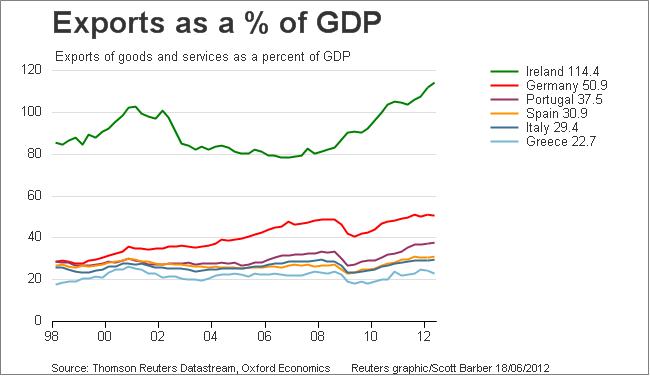
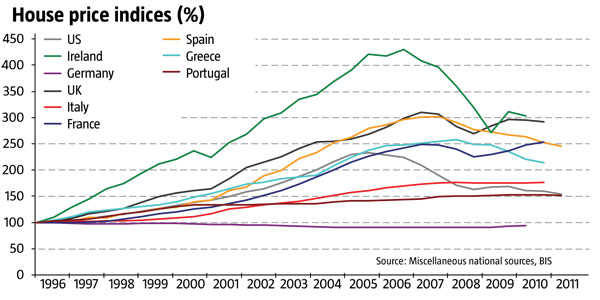
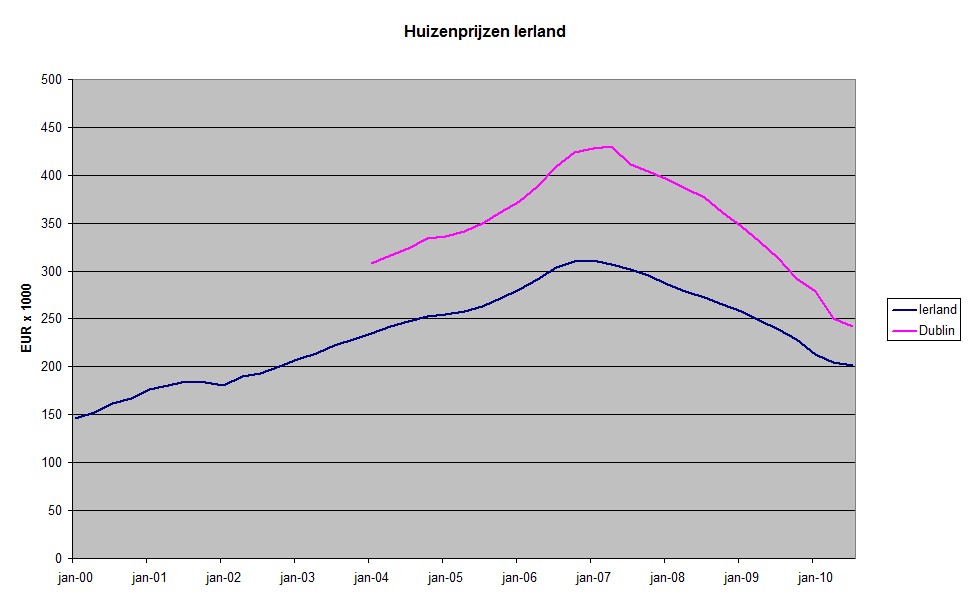
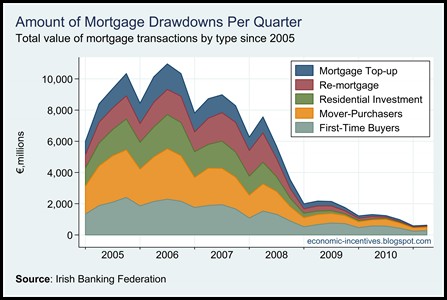
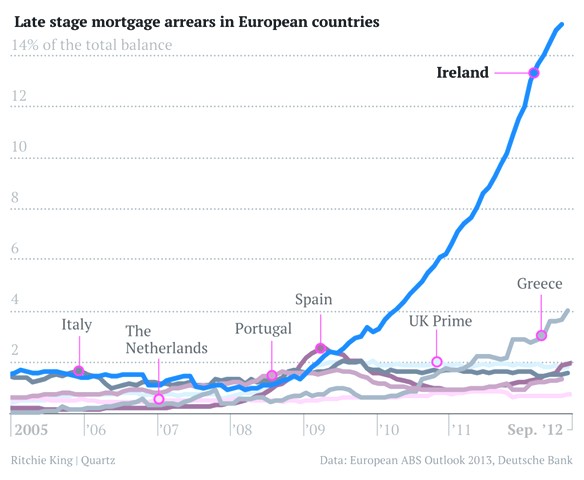
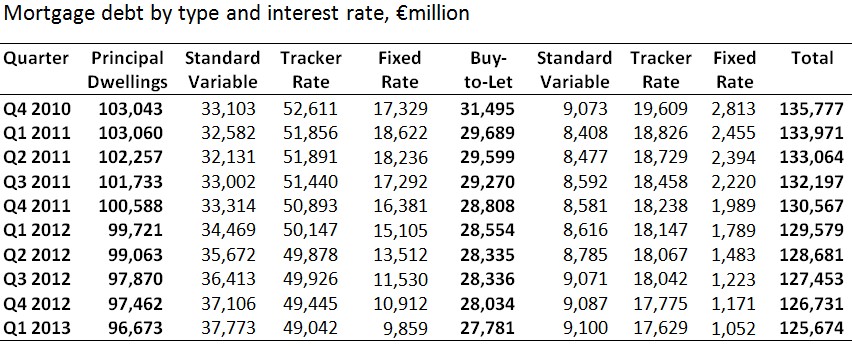
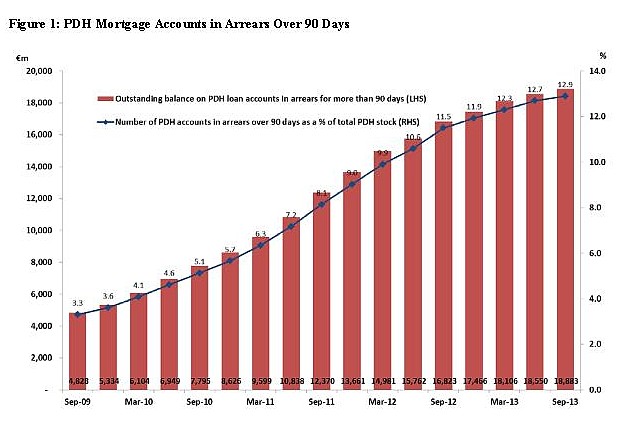
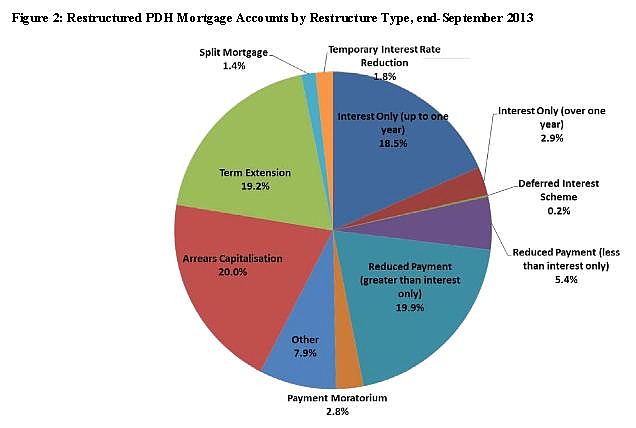
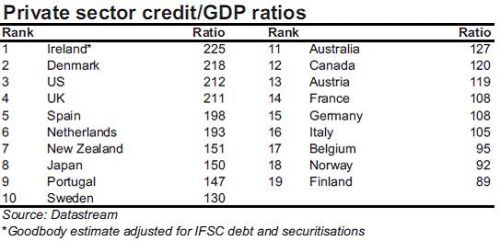
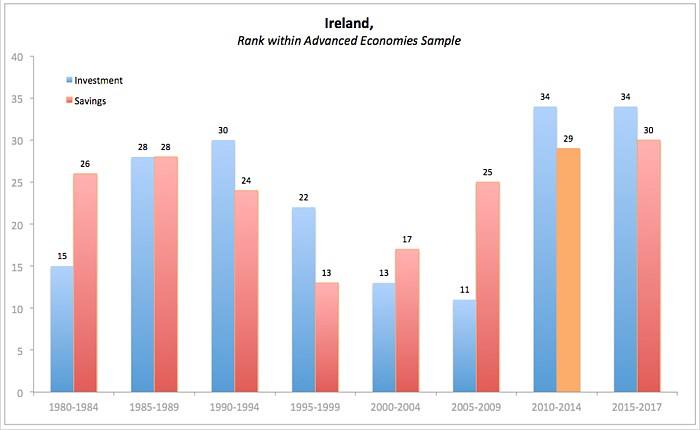
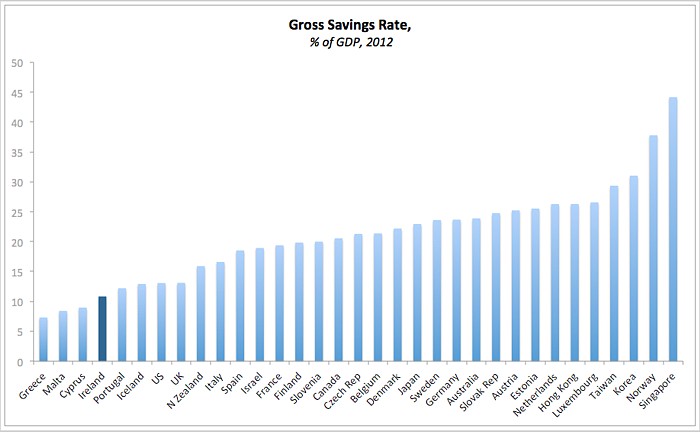
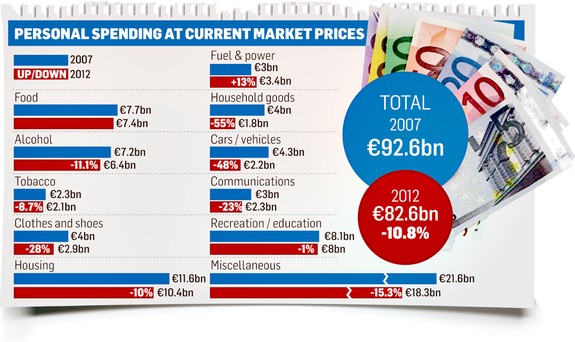
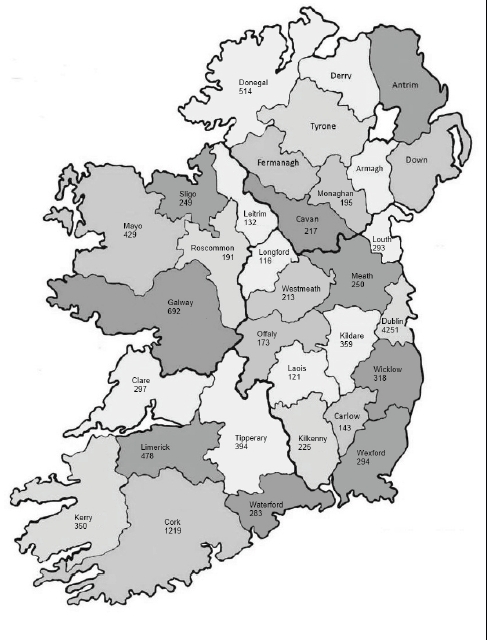
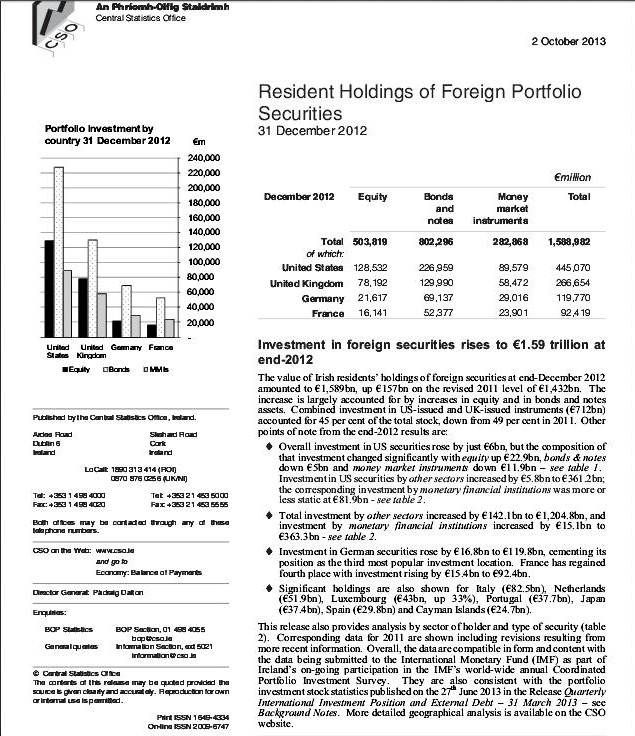

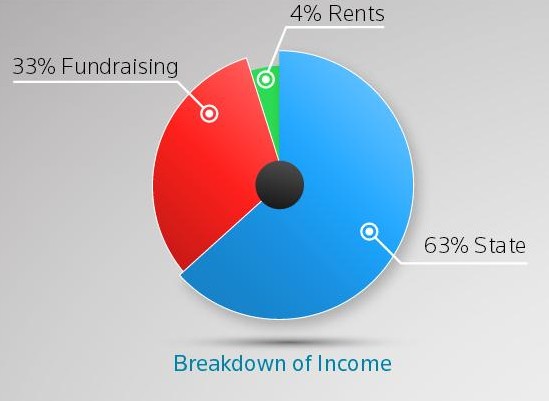
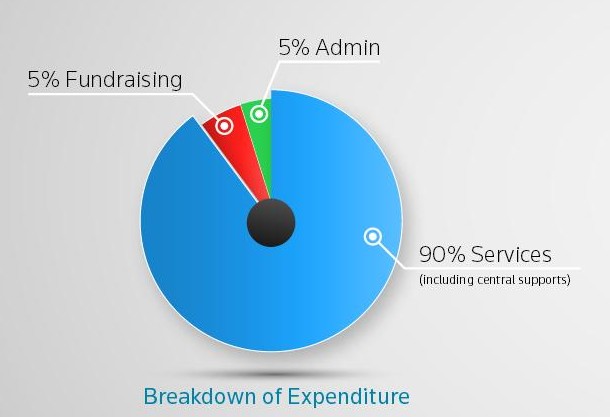

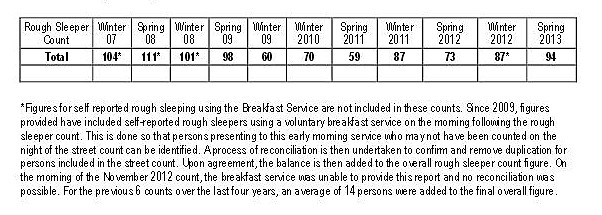
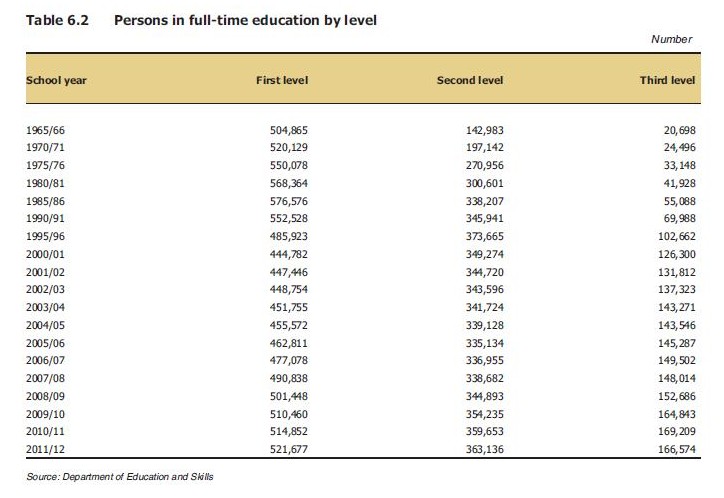
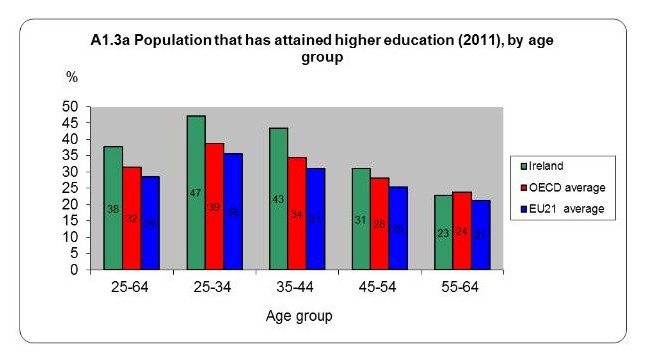
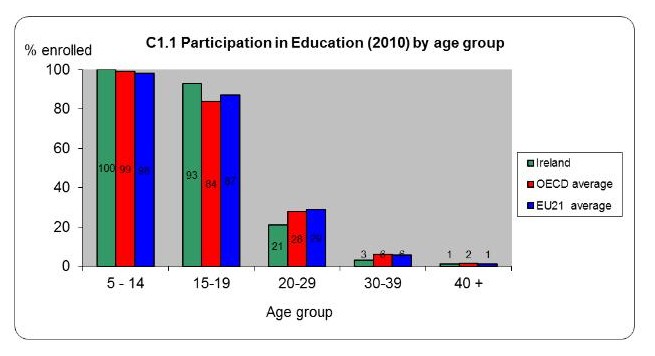
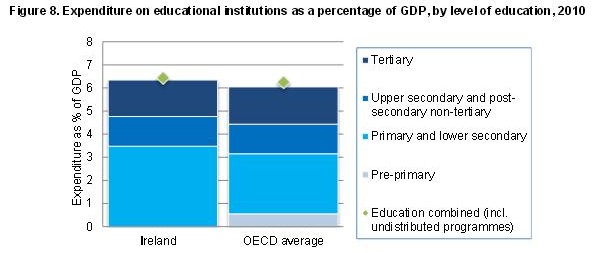
.JPG)